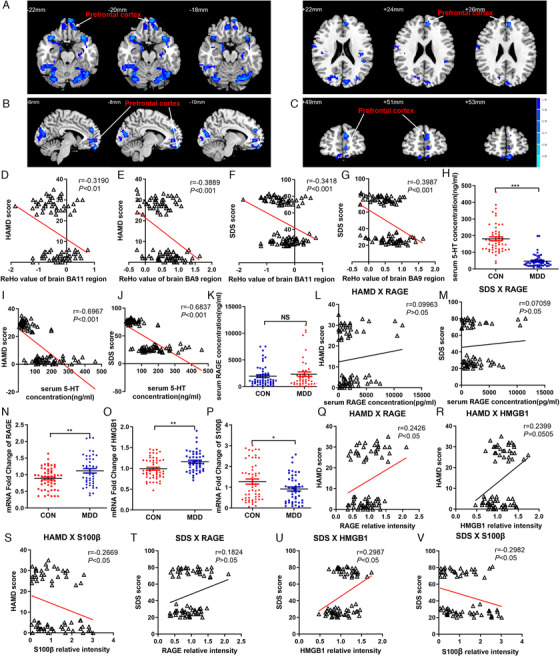
FIGURE 1.

Study on the ReHo changes of brain rs‐fMRI and RAGE‐DAMPs in patients with MDD. (A)–(C) Compared with the normal subjects, images of the horizontal, coronal, and sagittal planes show the decrease of prefrontal cortex BOLD‐signal of rs‐fMRI in the MDD patients according to the results of the ReHo analysis. The correlation between the scores of HAMD depression scale and the brain ReHo values of BA11 region (D) and BA9 region (E) of prefrontal cortex, respectively. The correlation between the scores of SDS anxiety scale and the brain ReHo values of BA11 region (F) and BA9 region (G) of prefrontal cortex, respectively. (H) Levels of 5‐HT in serum of MDD patients and normal subjects. The correlation between the scores of HAMD (I), SDS (J) and levels of 5‐HT in serum, respectively. (K) Levels of RAGE in serum of MDD patients and normal subjects. The correlation between the scores of HAMD (L), SDS (M), and levels of RAGE in serum, respectively. Fold changes of RAGE (N), HMGB1 (O), S100β (P) mRNA expression in peripheral leukocytes of MDD patients and normal subjects. The correlation between the scores of HAMD and mRNA expression of RAGE (Q), HMGB1 (R), S100β (S) in peripheral leukocytes, respectively. The correlation between the scores of SDS and mRNA expression of RAGE (T), HMGB1 (U), S100β (V) in peripheral leukocytes, respectively. The data are presented as means ± SEM. Two sample t‐test, * p < .05, ** p < .01, *** p < .001, MDD patients versus normal subjects. Spearman's correlation was used with a significance threshold of p < .05. n = 46, 54 (CON, MDD, respectively)
