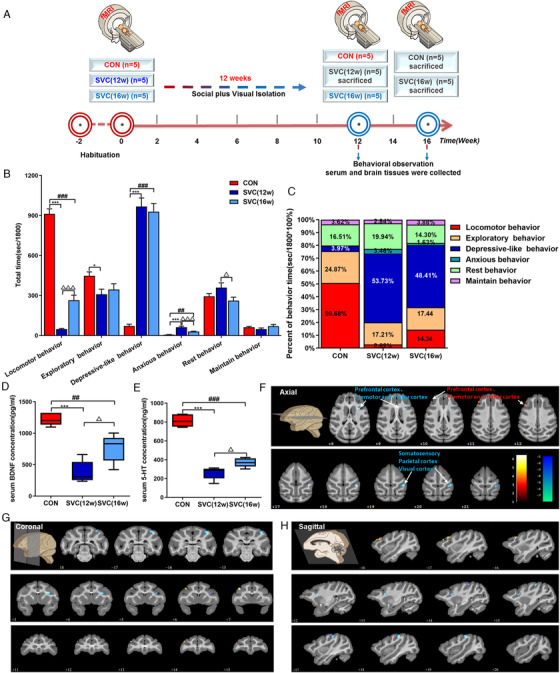
FIGURE 2.

Social plus visual isolation establishes an effective depression model of cynomolgus monkeys and caused the ReHo changes of brain rs‐fMRI. (A) Schematic showing experimental approach and timeline. (B), (C) Quantification of total time and proportion of behavior time in different groups of cynomolgus monkeys. Levels of 5‐HT (D) and BDNF (E) in serum of cynomolgus monkeys. Compared with the CON group, images of the axial (F), coronal (G), and sagittal (H) planes show the BOLD‐signal changes of rs‐fMRI in the SVC group according to the results of the ReHo analysis at the 12th week. The data are presented as means ± SEM. One‐way ANOVA followed by Bonferroni's post hoc test, * p < .05, *** p < .001. SVC (12w) group versus CON group; ## p < .001, ### p < .001. SVC (16w) group versus CON group; △ p < .05. SVC (16w) group versus SVC (12w) group; n = 5, 5, 5 (CON, SVC [12w], SVC [16w], respectively). The voxel‐level height threshold was p < .005 (uncorrected) and the cluster‐extent threshold was 20 voxels
