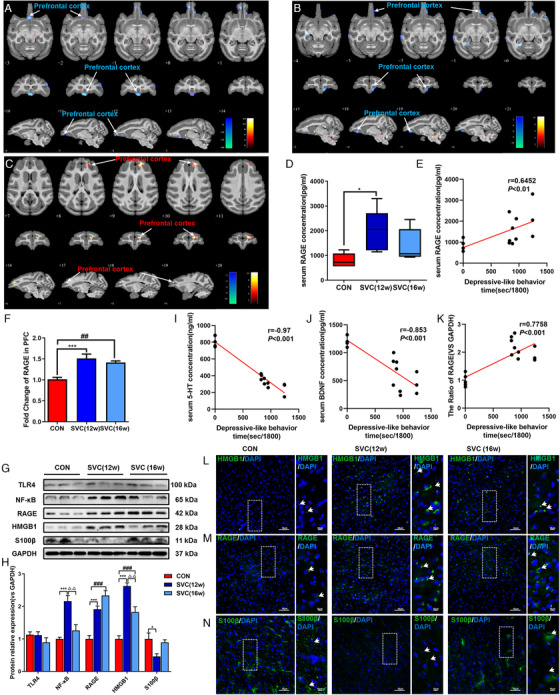
FIGURE 3.

Social plus visual isolation exposure induced persistent decrease of ReHo value and increase of RAGE in PFC of cynomolgus monkeys. (A)–(C) The ReHo value changes of rs‐fMRI in PFC of SVC monkeys at different time points from three levels: horizontal, coronal and sagittal, respectively; (A) 12th week vs 0th week; (B) 16th week vs 0th week; (C) 16th week vs 12th week. The voxel‐level height threshold was p < .005 (uncorrected) and the cluster‐extent threshold was 20 voxels. (D) Expression of RAGE in serum of cynomolgus monkeys, n = 5, 5, 5 (CON, SVC [12w], SVC [16w], respectively). (E) Relationship between RAGE expression in serum and depressive‐like behavior in cynomolgus monkeys. (F) Expression of RAGE mRNA in PFC of cynomolgus monkeys. (G), (H) Western blot and semiquantitative results of TLR4, NF‐κB, RAGE, HMGB1 and S100β in mPFC of cynomolgus monkeys. Relationship between 5‐HT (I) and BDNF (J) expression in serum and depressive‐like behavior in cynomolgus monkeys. (K) Relationship between the ratio of RAGE mRNA expression in PFC and depressive‐like behavior in cynomolgus monkeys. Immunofluorescence of HMGB1 (L), RAGE (M), and S100β (N) in mPFC of cynomolgus monkeys. White scale bar represents 10 μm. The data are presented as means ± SEM. One‐way ANOVA followed by Bonferroni's post hoc test. * p < .05, *** p < .001. SVC (12w) group versus CON group; ### p < .001. SVC (16w) group versus CON group; △△ p < .01. SVC (16w) group versus SVC (12w) group. , Representative data from WB, qPCR, and IF at least 3 independent experiments are shown; n = 5, 5, 5 (CON, SVC [12w], SVC [16w], respectively). Spearman's correlation was used with a significance threshold of p < .05
