
FIGURE 4.
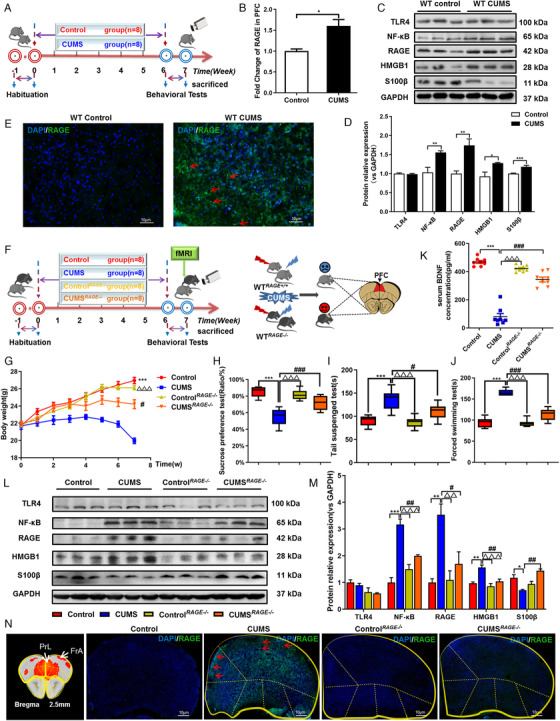
RAGE knockout is resilient to CUMS Exposure and increase interhemispheric and intrahemispheric rs‐fMRI connectivity in PFC of mice. (A) Schematic overview of CUMS experimental approach and timeline. (B) The mRNA fold change of RAGE in PFC of mice were detected by qPCR. (C), (D) Western blot and semiquantitative results of TLR4, NF‐κB, RAGE, HMGB1 and S100β in PFC of mice. (E) Immunofluorescence expression of RAGE in PFC of mice. (F) Schematic showing experimental approach and timeline. The CUMS model was established in WT mice combined with RAGE –/– mice, and the brain was scanned with rs‐fMRI. (G) Body weight changes in mice, n = 8, respectively. Mice behavioral tests. (H) Sucrose preference test (SPT); (I) tail suspension test (TST); (J) force swimming test (FST), n = 8, respectively. (K) Expression of BDNF in serum of four groups of mice, n = 8, respectively. (L), (M) Western blot and semiquantitative results of TLR4, NF‐κB, RAGE, HMGB1, and S100β in PFC of mice. (N) Immunofluorescence showed that RAGE knockout could downregulate the expression of RAGE in PFC of CUMS depressive‐like mice. One‐way ANOVA followed by Bonferroni's post hoc test; * p < .05, ** p < .01, and *** p < .001, CUMS group versus Control group; # p < .05, ## p < .01, and ### p < .001, CUMS group versus CUMS RAGE–/– group; △ p < .05, △△ p < .01, and △△△ p < .001, CUMS group versus Control RAGE–/– group; Error bars indicate mean ±SEM. White scale bar represents 10 μm. Representative data from WB, qPCR and IF at least 3 independent experiments are shown; n = 8, 8, 8, 8 (Control, CUMS, Control RAGE–/– , CUMS RAGE–/– , respectively)