
Figure 2. PBMCs from subjects with T2D preferentially metabolize by glycolysis compared to PBMCs from ND subjects.
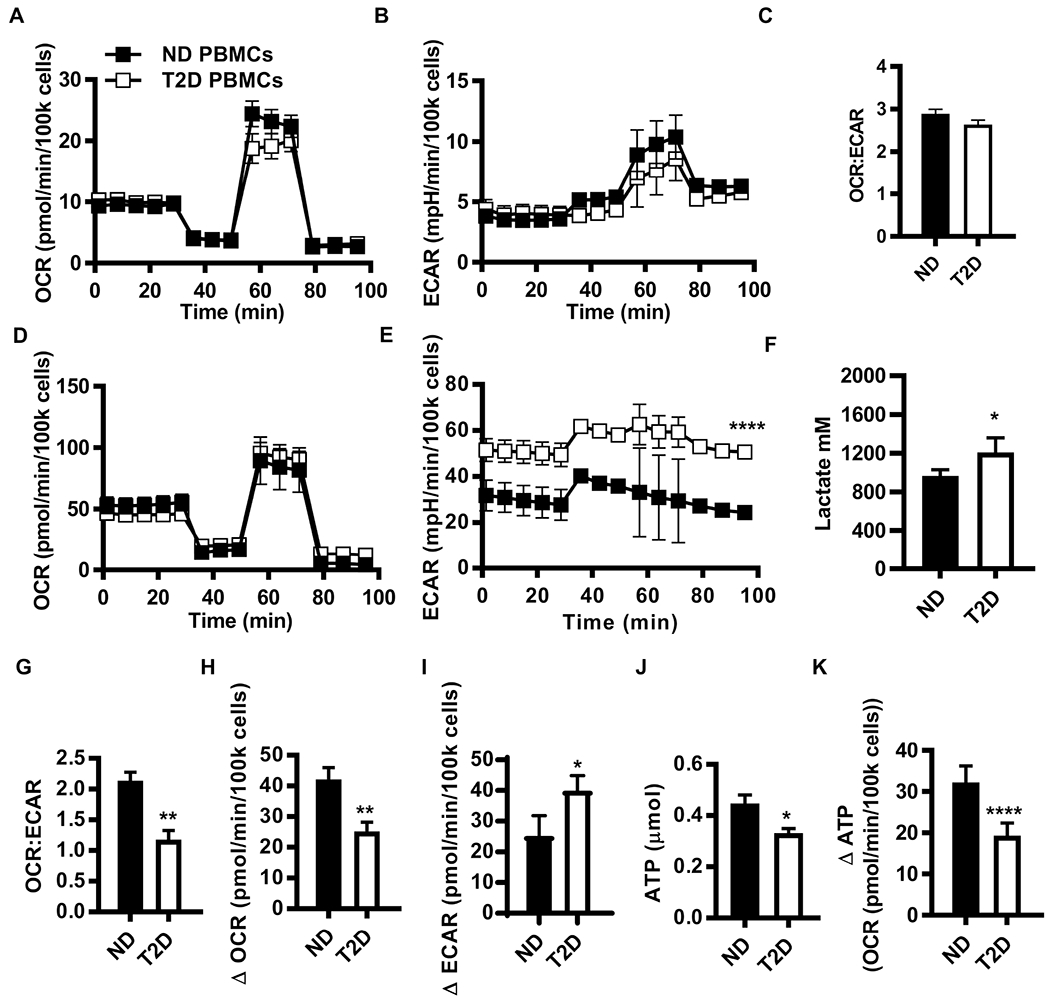
(A) OCR, (B) ECAR, and (C) OCR:ECAR ratio from mito stress test extracellular flux profiles for resting PBMCs from ND (N=17) and T2D (N=12) subjects. (D) OCR and (E) ECAR mito stress test extracellular flux profiles for 40 hr αCD3/αCD28-stimulated PBMCs from ND (N=10) and T2D (N=11) subjects. Differences are determined by repeated measures ANOVA with significance accepted at p < 0.05. (F) Lactate in conditioned media from ND (N=5) and T2D (N=6) PBMCs after 40 hr αCD3/αCD28 stimulation. (G) The OCR:ECAR ratio for 40 hr αCD3/αCD28 stimulated PBMCs. The absolute difference in basal OCR (H) and ECAR (I) between resting PBMCs (A,B) and 40 hr αCD3/αCD28-stimulated PBMCs (ND, N=10; T2D, N=11). (J) Direct measurement of ATP production by bioluminescence in resting ND (N=7) and T2D (N=6) PBMCs. (K) Fold change in ATP production due to 40 hr αCD3/CD28 activation of PBMCs. Differences are determined by two-tailed student’s t test with significance accepted at p < 0.05. See also Fig. S3 and Table S1.