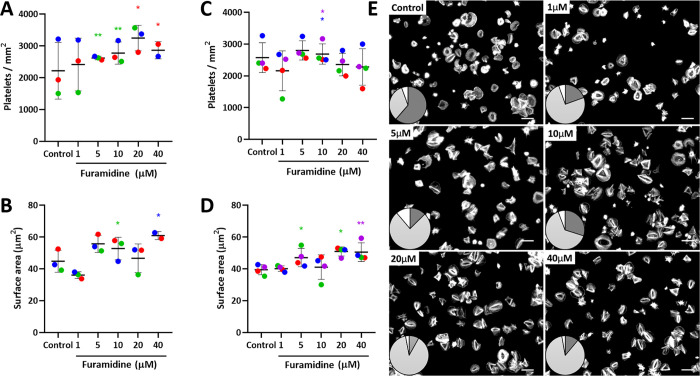
Figure 4.
Mild changes in spreading after incubation of platelets with furamidine. (A–D) Number of platelets and platelet surface area on spreading onto fibrinogen (A,B) or collagen (C,D) in the absence (control) or in the presence of increasing concentrations of furamidine for 4 h. Data are shown as the mean ± SD (error bars), with the data points from each donor (n = 3 donors for fibrinogen and n = 4 donors for collagen, five slides analyzed from each donor) linked to make donor-specific comparisons. Donors are color coded. Statistical comparisons are shown between samples from the same donor. Stars indicating statistical relevance (* p < 0.05; ** p < 0.005) are colored according to the donor where any difference between treated and control samples was found to be significant (ANOVA with post hoc Tukey tests). (E) Representative images of platelets spreading on fibrinogen after treatment with a range of furamidine concentrations (4 h); all images are from the same donor. Inset: visualization of spreading phenotype: actin nodules (dark gray), stress fibers (light gray), and mixed phenotype or nonclassifiable (white).

