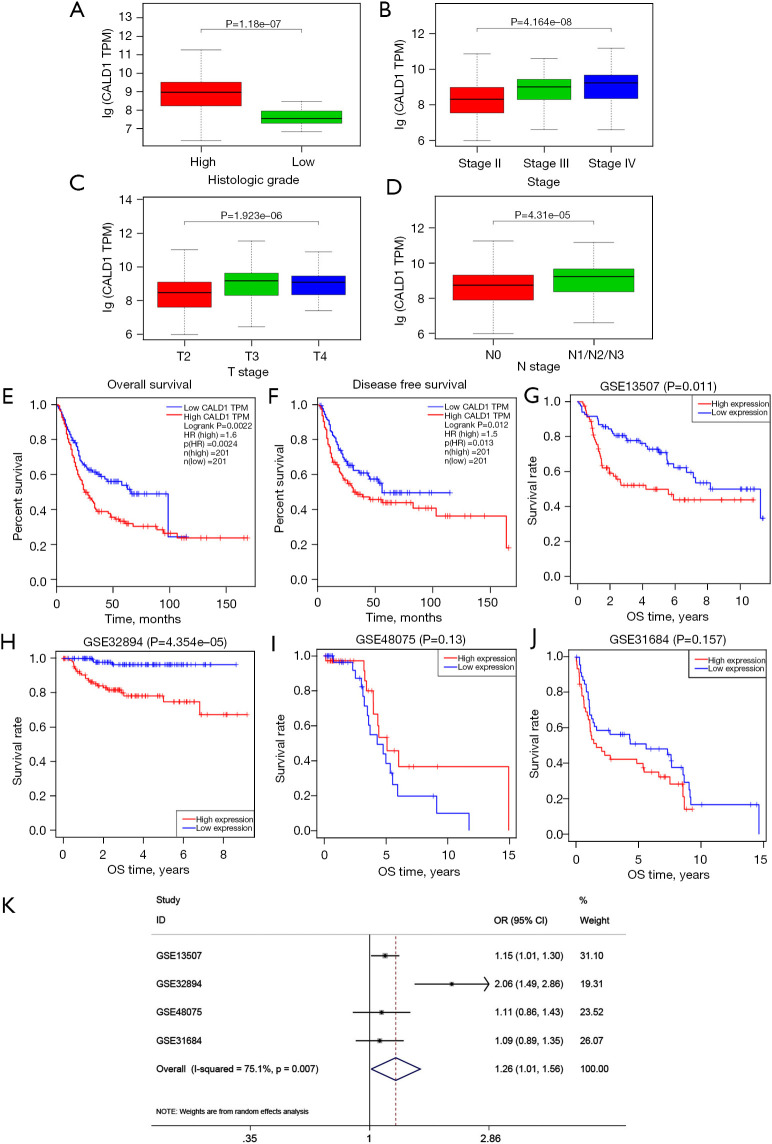
Figure 2.
Clinical correlation of CALD1. (A-D) Expression of the CALD1 gene among distinct clinical characteristics in BC patients. (E,F) Kaplan-Meier survival curves for OS (E) and DFS (F) comparing the high and low expression of CALD1 in BC (GEPIA). (G-J) Kaplan-Meier survival curves for OS comparing the high and low expression of CALD1 in GSE13507 (G), GSE32894 (H), GSE48075 (I), and GSE31684 (J). (K) Forest plot for the association between CALD1 expression and OS in BC. BC, bladder cancer; OS, overall survival; DFS, disease-free survival; GEPIA, Gene Expression Profiling Interactive Analysis; TPM, trusted platform module; OR, odds ratio; CI, confidence interval.

