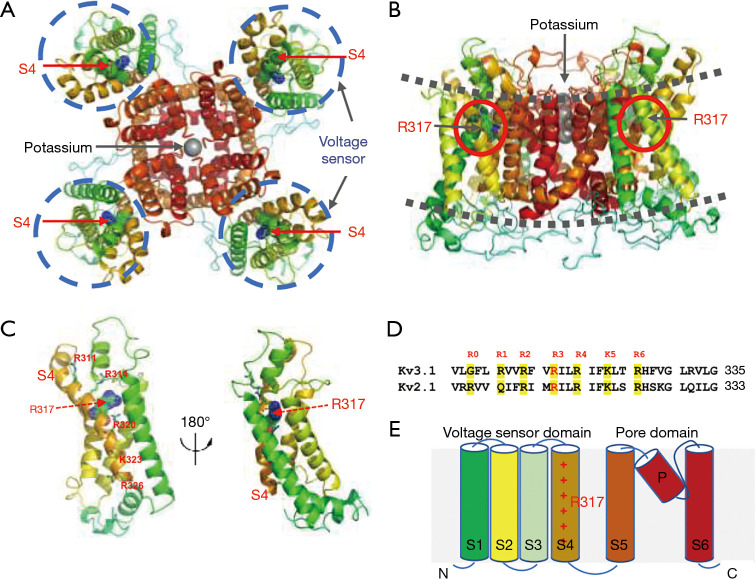
Figure 3.
In silico analysis and structural analysis of Kv3.1 potassium channel involved p.R317S mutation. (A) Top view of ribbon representation of the Kv3.1 potassium channel model and the voltage sensor domains were highlighted in dash-line circle colored in blue. (B) Side view of ribbon representation of the Kv3.1 potassium channel model and lipid bilayer were highlighted in dash-line colored in grey. (C) Rotational view of ribbon representation of the selective filter region of Kv3.1 potassium channel model. (D) The amino acid sequence alignment of selective filter regions showed the high degree conservation of these key Arginine (R0–R6) residues. (E) The schematic representation of Kv3.1 potassium channel model by cartoon diagram.

