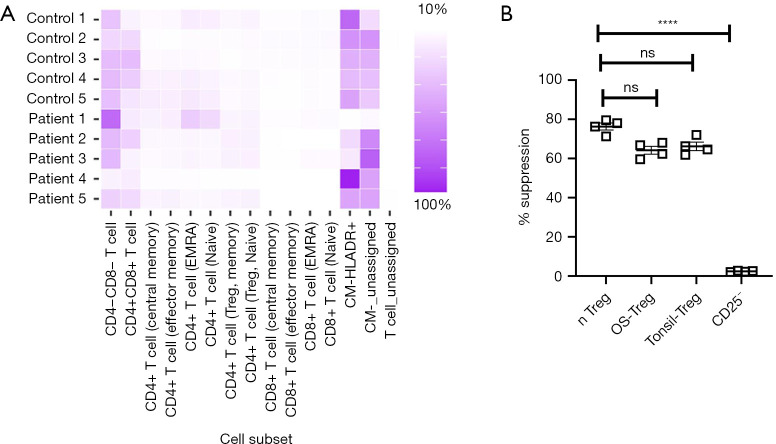
Figure 2.
Intact suppression activity of tumor-infiltrating Tregs in OS. (A) Relative indicated T cell subtypes among tumor-infiltrating T cells was done using a self-organizing map (FlowSOM) and visualized as pie charts (MST plots). No enrichment of specific T cell subtypes was observed. (B) Relative suppressor capacity of Tregs isolated from OS patients, freshly isolated ‘natural’ Tregs [nTregs (CD3+CD4+CD25Bright)], tonsil, or CD25– cells (n=4 each). Data are mean ± SD. ****, P<0.0001, ns, not significant (P>0.05)—one-way ANOVA with Turkey’s post hoc test. Tregs, regulator T cells; OS, osteosarcoma; MST, minimal spanning tree.

