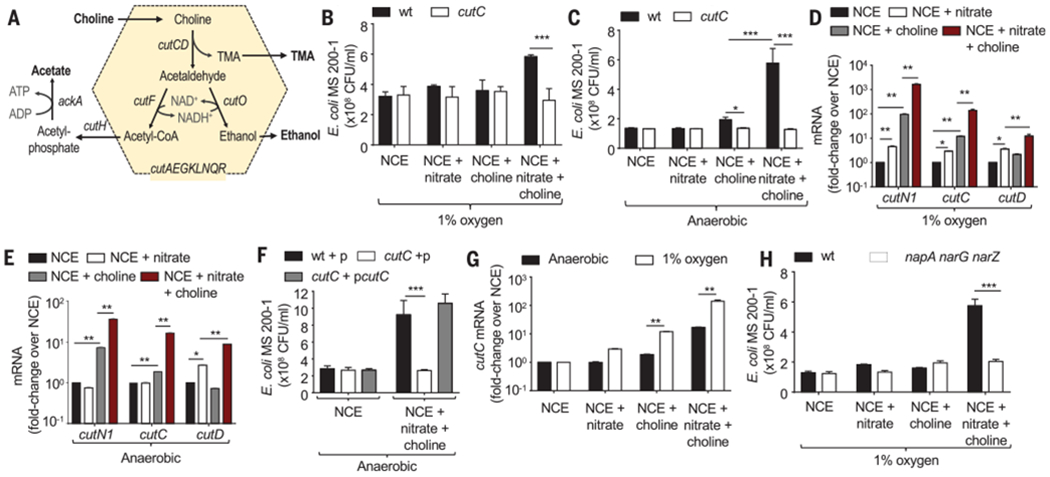
Fig. 2. E. coli choline catabolism requires nitrate respiration in vitro.

(A) Schematic of choline catabolism encoded by the cut gene cluster of E. coli MS 200-1. (B and C) In vitro growth of E. coli MS 200-1 (wt) and an isogenic cutC mutant in no-carbon essential (NCE) medium supplemented with the indicated nutrients in a hypoxia chamber with 1% oxygen (B) or in an anaerobic chamber (C). (D and C) Expression of the indicated genes was determined by quantitative real-time PCR in RNA isolated from E. coli MS 200-1, which was grown in the indicated media in a hypoxia chamber with 1% oxygen (D) or in an anaerobic chamber (E). (F) In vitro growth in an anaerobic chamber of E. coli MS 200-1 carrying a cloning vector (wt+p), a cutC mutant carrying a cloning vector (cutC+p), and a cutC mutant complemented with the cloned cutC gene (cutC+pcutC) in NCE medium supplemented with the indicated nutrients. (G) Expression of cutC was determined by quantitative real-time PCR in RNA isolated from E. coli MS 200-1 grown under the indicated conditions. (H) In vitro growth of E. coli MS 200-1 (wt) and an isogenic napA narG narZ mutant in NCE medium supplemented with the indicated nutrients, in a hypoxia chamber with 1% oxygen. (B to H) Bars represent geometric means ± geometric error. n = 4 biological replicates (average of triplicate technical replicate per biological replicate). *, P < 0.05; **, P < 0.01; ***, P < 0.001 using an unpaired two-tailed Student’s t test [(B), (C), (G), and (H)] or a one-way analysis of variance (ANOVA) followed by Tukey’s HSD test [(D) to (F)].
