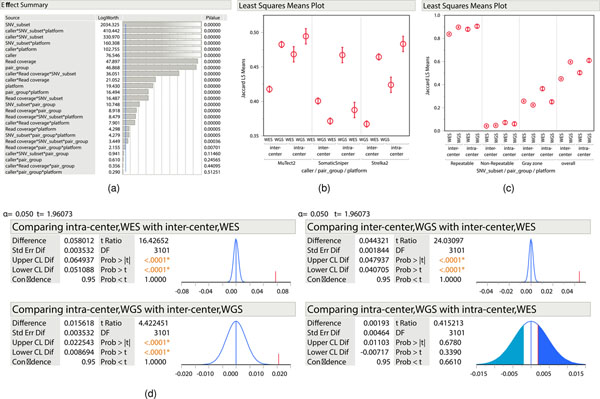
Extended Data Fig. 8 |. Sources of variation in Jaccard index.
(a) Summary of factor effects. Twenty-five factors, including five original factors, ten 2-way interactions, and ten 3-way interactions were evaluated in the model. Both P values (derived from F-test) and their LogWorth (−log10 (P value)) are included in the summary plot. The factors are ordered by their LogWorth values. (b) Least square means of caller*pair_group*platform interaction. The height of the markers represents the adjusted least square means, and the bars represent confidence intervals of the means. (c) Least square means SNV_subset*pair_group*platform interaction. The height of the markers represents the adjusted least square means, and the bars represent confidence intervals of the means. 3168 samples were used to derive these statistics. (d) Student’s t-test for platform*pair_group interaction with SNV calls from three callers, MuTect2, Strelka2, and SomaticSniper. The left two panels compare Jaccard indices between intra-center and inter-center for WGS and WES, respectively. The right two panels compare Jaccard indices between WGS and WES for inter-center and intra-center pairs, respectively. Prob > |t| is the two-tailed test P value, and Prob > t is the one-tailed test P value.

