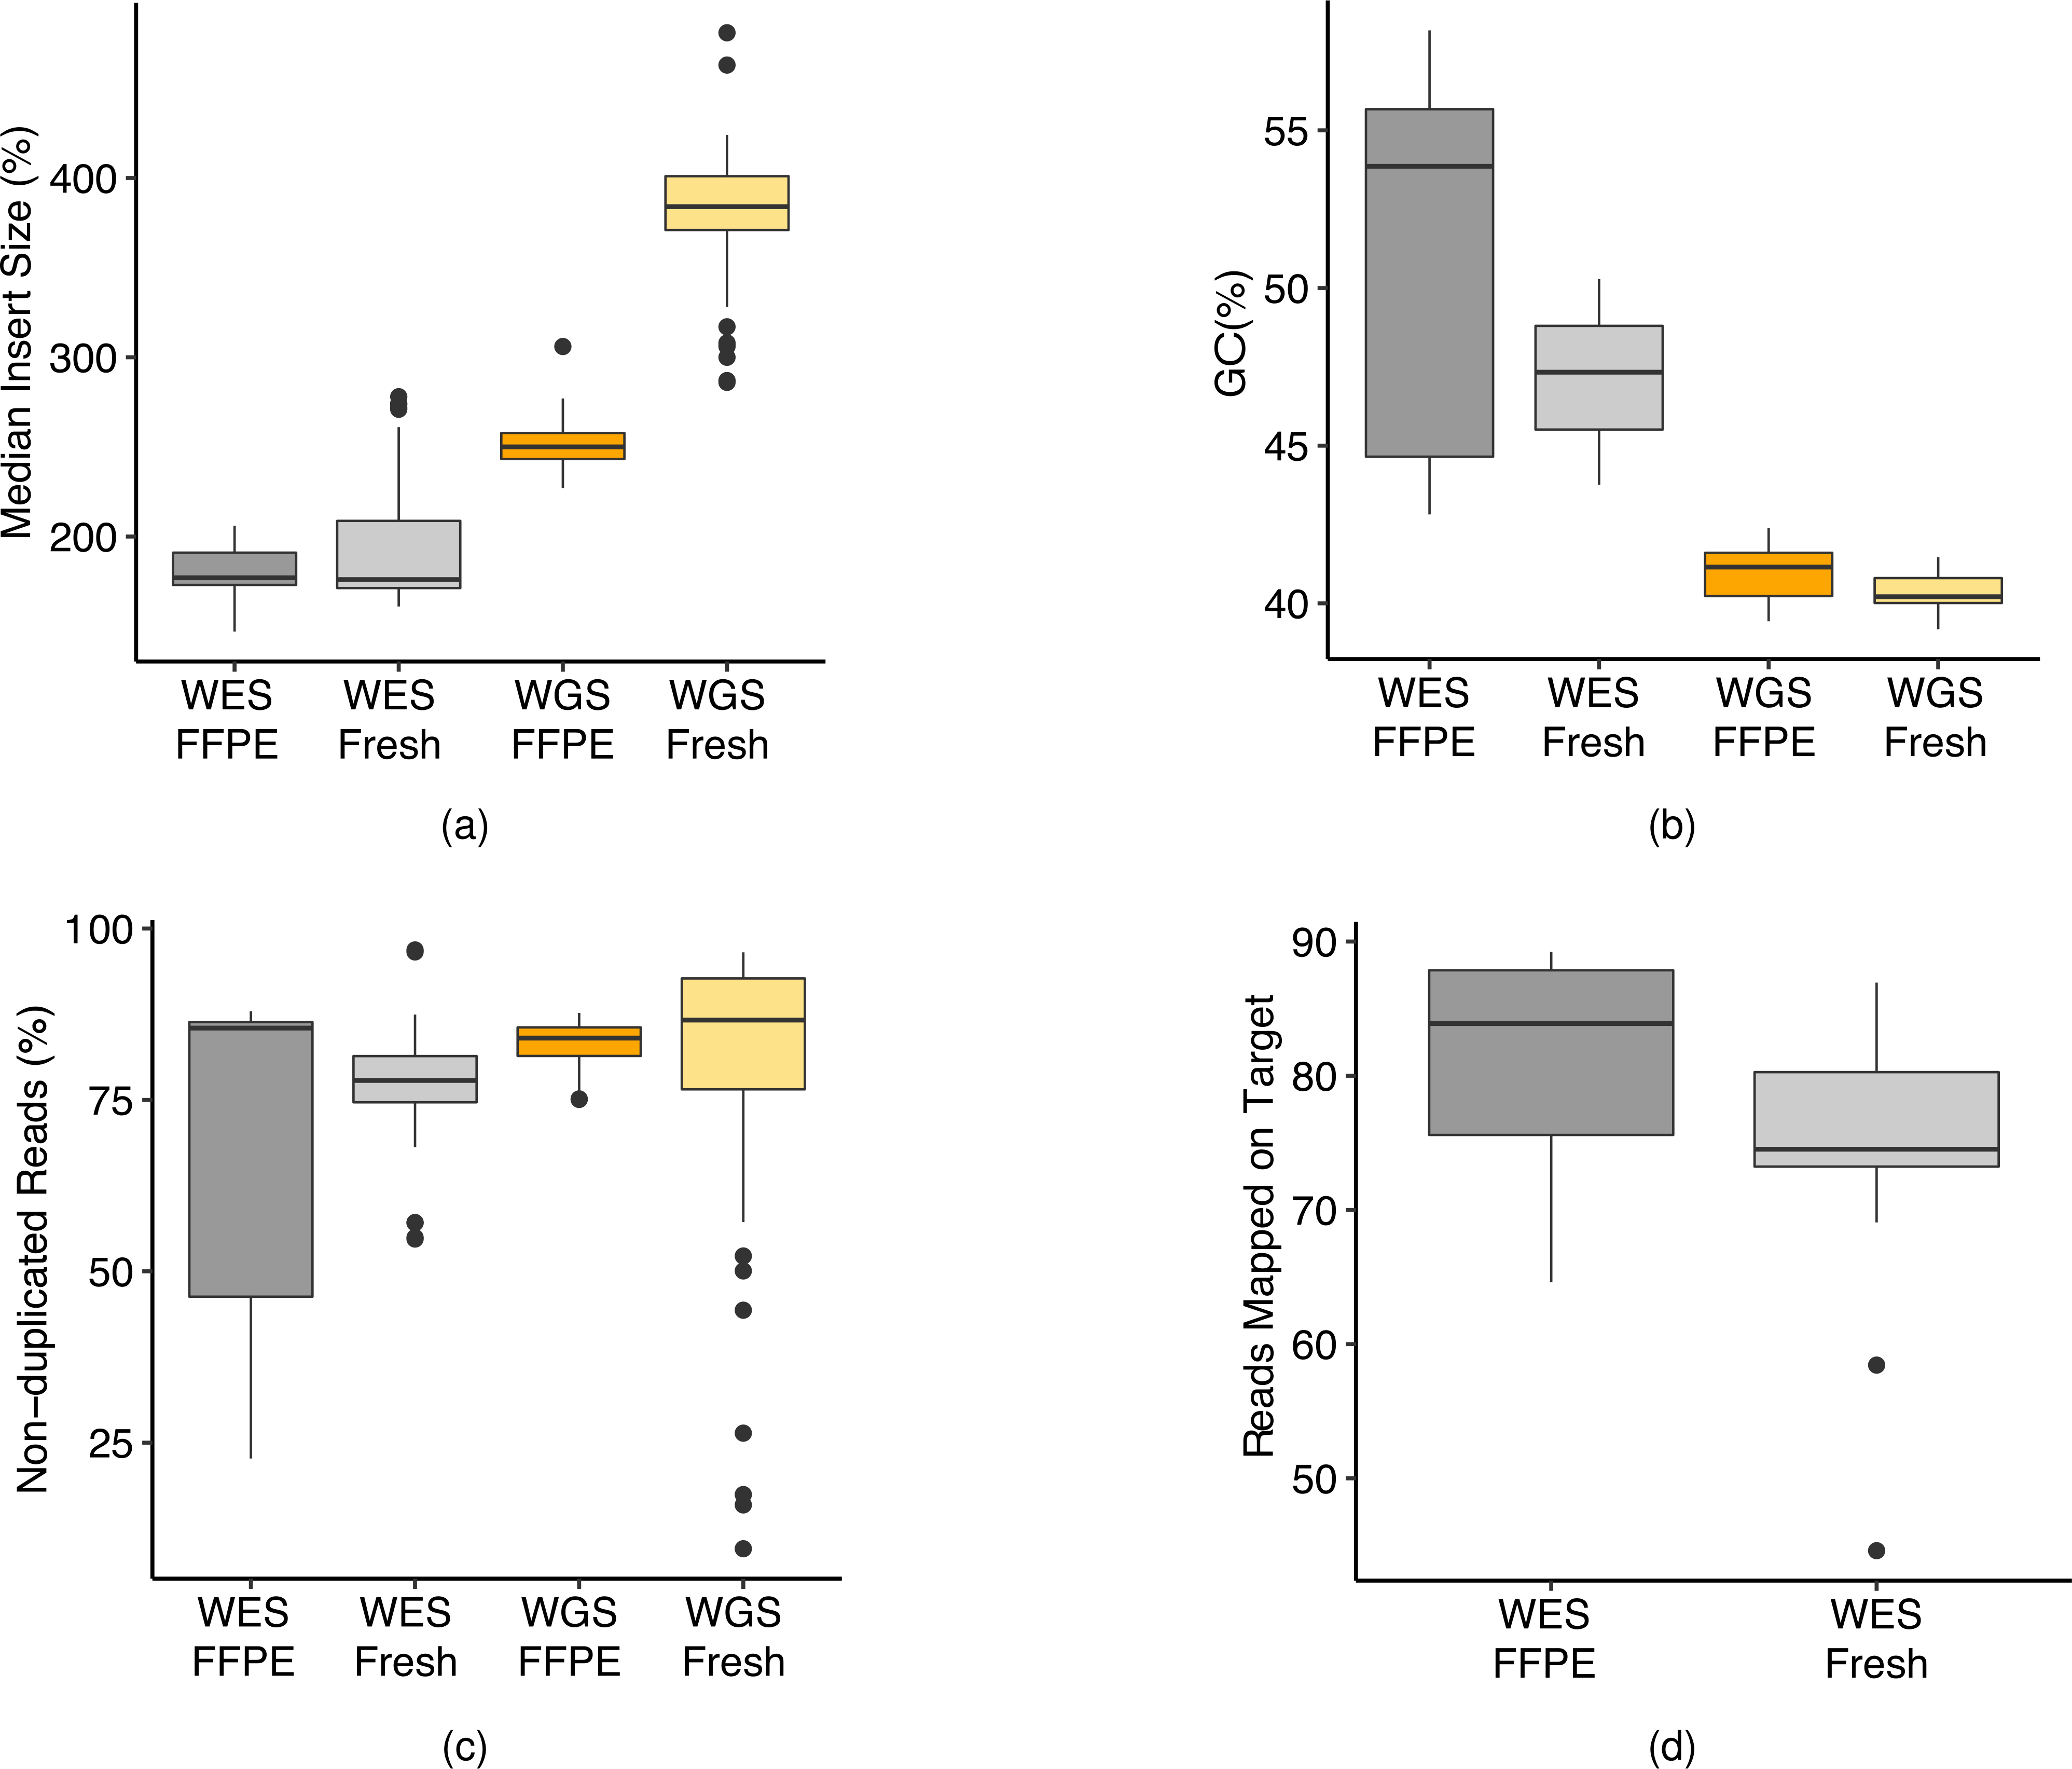
Extended Data Fig. 3 |. Overall read quality distribution for all WES and WGS runs.

(a) Median insert fragment size of WES and WGS run on fresh and FFPE DNA. (b) G/C read content for Wes and WGS runs. (c) Overall read redundancy for WES and WGS runs. Some outliers were observed in WGS on fresh DNA, which were from runs of TruSeq-Nano with 1 ng of DNA input. (d) Overall percentage of reads mapped to target regions for WES runs for fresh and FFPE DNA. For detailed statistics regarding the boxplot, please refer to Supplementary Table 6.
