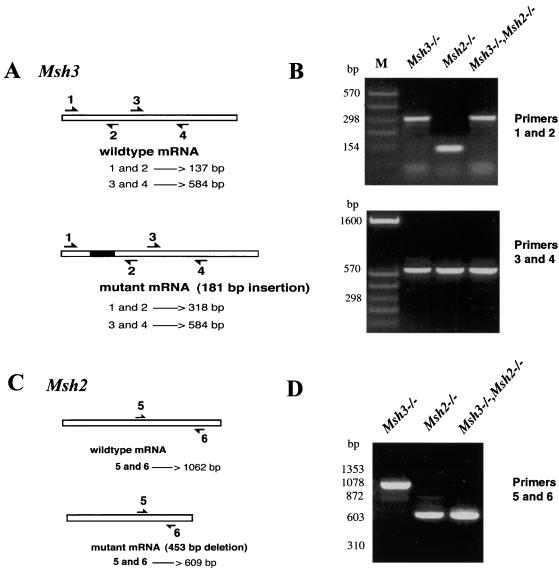
FIG. 1.
RT-PCR analysis of Msh3 and Msh2 transcripts. (A) Diagram of wild-type and mutant Msh3 transcripts and the position of PCR primers. Predicted sizes of amplification products are given in base pairs. (B) Agarose gel electrophoresis of amplification products from msh3−/−, msh2−/−, and msh2,3−/− ES cells. M, DNA size standard. (C) Diagram of wild-type and mutant Msh2 transcripts and the position of PCR primers. Predicted sizes of amplification products are given in base pairs. (D) Agarose gel electrophoresis of amplification products from msh3−/−, msh2−/−, and msh2,3−/− ES cells.

