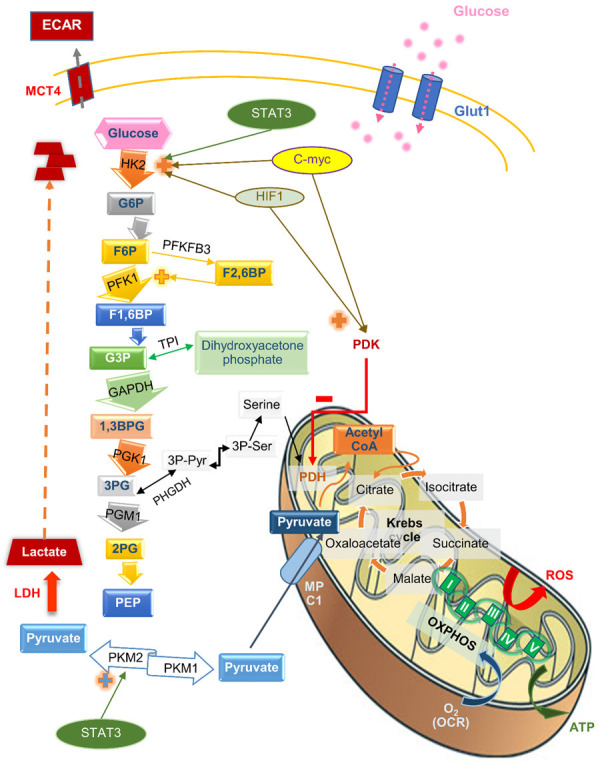
Figure 1.

The pathways and regulation of glycolysis, the TCA cycle, and oxidative phosphorylation. The figure shows glucose metabolism from its uptake into the cell, the metabolic pathways, including the glycolytic pathway in the cell cytoplasms, the tricarboxylic acid cycle, and the mitochondrial oxidative phosphorylation, and its regulatory enzymes and metabolites. Abbreviations: 1, 3BPG, 1, 3-bisphosphoglycerate; 2PG, 2-phosphoglycerate; 3PG, 3-phosphoglycerate; 3PPyr, 3 phosphopyruvate; 3PSer, 3 phosphoserine; ECAR, extracellular acidification rate; F1, 6BP, fructose-1,6-bisphosphate; F6P, fructose-6-phosphate; G3P, glyceraldehyde-3-phosphate; G6P, glucose-6-phosphate; GAPDH, glyceraldehyde 3-phosphate dehydrogenase; HIF1, hypoxia-induced transcription factor 1; HK2, hexokinase 2; LDH, lactate dehydrogenase; MCT4, monocarboxylate transporter 4; MPC1, mitochondrial pyruvate carrier 1; OCR, oxygen consumption rate; PDH, pyruvate dehydrogenase; PDK, pyruvate dehydrogenase kinase; PEP, phosphoenolpyruvate; PFK1, phosphofructokinase 1; PFKFB3, 6-phosphofructo-2-kinase/fructose-2,6-biphosphatase 3; PGM1, phosphoglucomutase 1; PHGDH, phosphoglycerate dehydrogenase; PK, pyruvate kinase; ROS, reactive oxygen species; TPI, triosephosphate isomerase.
