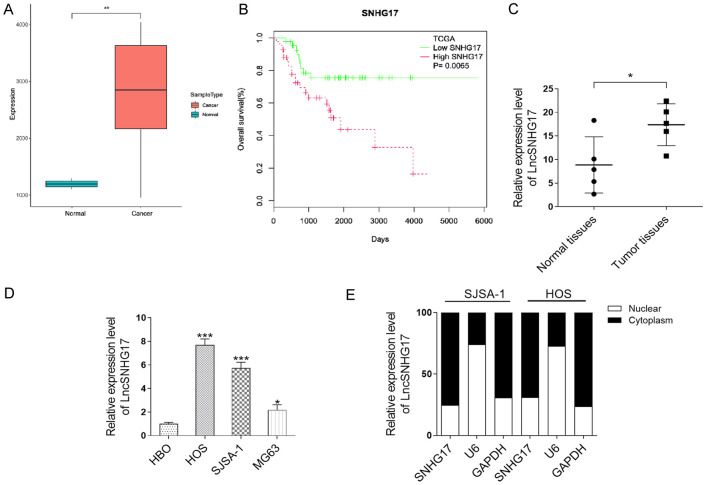
Figure 1.
LncRNA SNHG17 is upregulated in the OS tissues and corresponding with the poor prognosis of OS. A. Relative expression of SNHG17 in human OS tissues compared with adjacent normal tissue via TCGA data analysis. B. Kaplan-Meier overall survival curves were performed based on the LncRNA SNHG17 expression level. C. The expression level of LncRNA SNHG17 in OS clinical samples (n = 5) were measured by qRT-PCR. *P<0.05 vs. the normal tissues. D. LncRNA SNHG17 expression was determined by qRT-PCR analysis in a normal cell line (HBO) and OS cell lines (MG63, HOS, and SJSA-1). *P<0.05, **P<0.01, ***P<0.001 vs. the HBO group. E. Localization of LncRNA SNHG17 in SJSA-1 and HOS cells.

