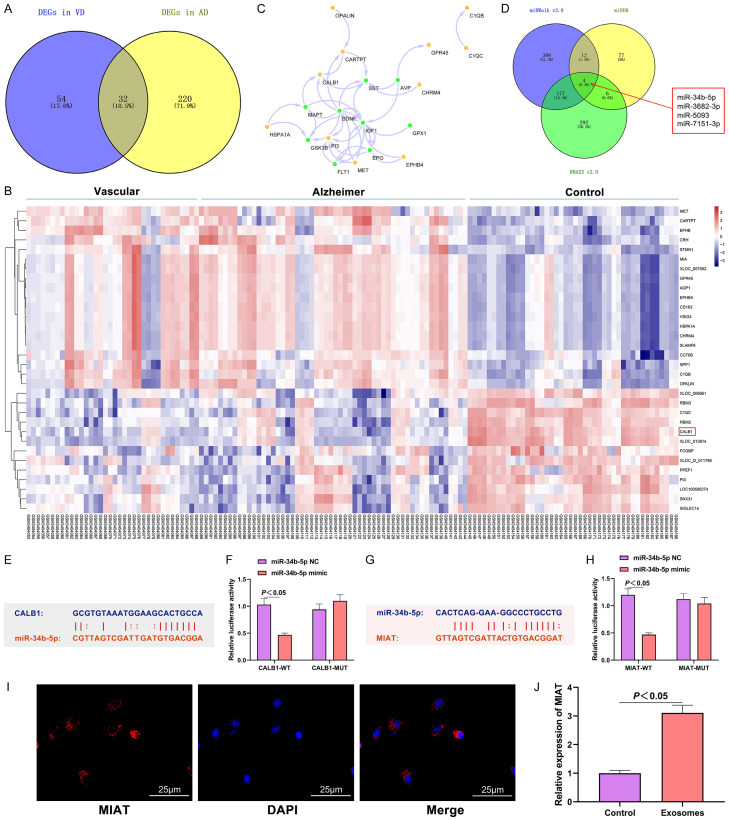
Figure 4.
MIAT regulated the expression of CALB1 by adsorbing the miR-34b-5p. A: The intersection of the differential genes between Alzheimer’s disease and VD; B: Heat map of the expression profiles of the differential genes (horizontal axis: sample number; vertical axis: gene symbol); the red in the upper right corner indicates up-regulation, and the blue indicates down-regulation; C: The interaction network between the intersected genes and the VD risk gene set; the yellow circles represent the intersected genes; the green circles represent the VD risk genes; the arrows indicate the regulatory relationship; D: The miRNAs targeting CALB1 predicted by miRDB, miRWalk and RNA22; E: Complementary base-pairing of CALB1 and miR-34b-5p; F: Verification of the targeting relationship between CALB1 and miR-34b-5p; G: Complementary base-pairing of MIAT and miR-34b-5p; H: Verification of the targeting relationship between CALB1 and miR-34b-5p; I: Subcellular localization of MIAT in neural stem cells (400×); J: Expression of MIAT in exo. N=6, and the experiment was repeated 3 times. VD: vascular dementia; exo: exosome; MIAT: myocardial infraction association transcript.

