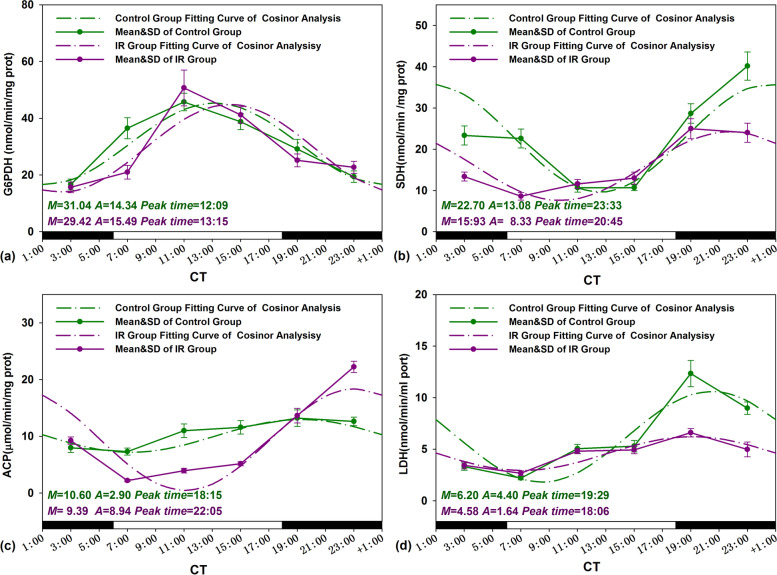
Fig. 4.
Circadian rhythm of testis mark enzymes activities of Control and IR mice. The best-fitting curves (means ± standard error) determined for G6PDH (a), SDH (b), ACP (c), and LDH (d); Y-axis represents testis mark enzymes activities; x-axis represents the time during the 24-h light-dark cycle; M and A represents the median and the amplitude of the rhythm, respectively. Mice were exposed to X-ray (3 Gy) at CT 3:00, CT 7:00, CT 11:00, CT 15:00, CT 19:00, and CT 23:00 in a 24-h CT period. Control mice were in the same experimental circumstances without being exposed to X-ray. The white and dark boxes on the x-axis represent light and dark

