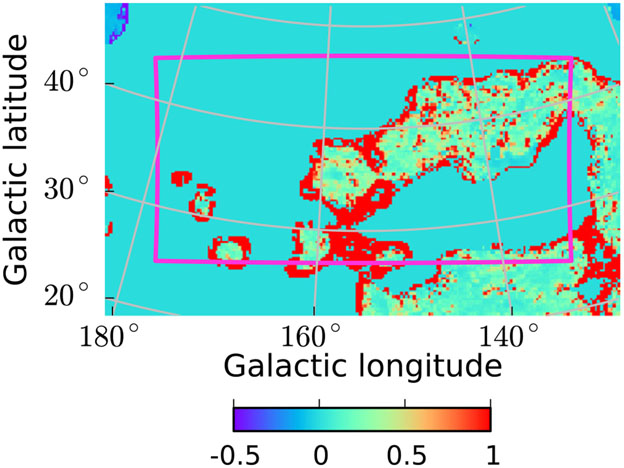
Figure 20.
Difference of the filtered dust residual map from the last iteration minus the map from iteration zero, divided by the former. We show as an example in ROI A the case for which the radiance map R is considered and the errors in the definition of the χ2 are assumed to be proportional to M as defined in Equation (4). The map is shown in the plate carrée projection used in the dust and γ-ray fits for ROI A, and the magenta line shows the border of the region considered in the fit.

