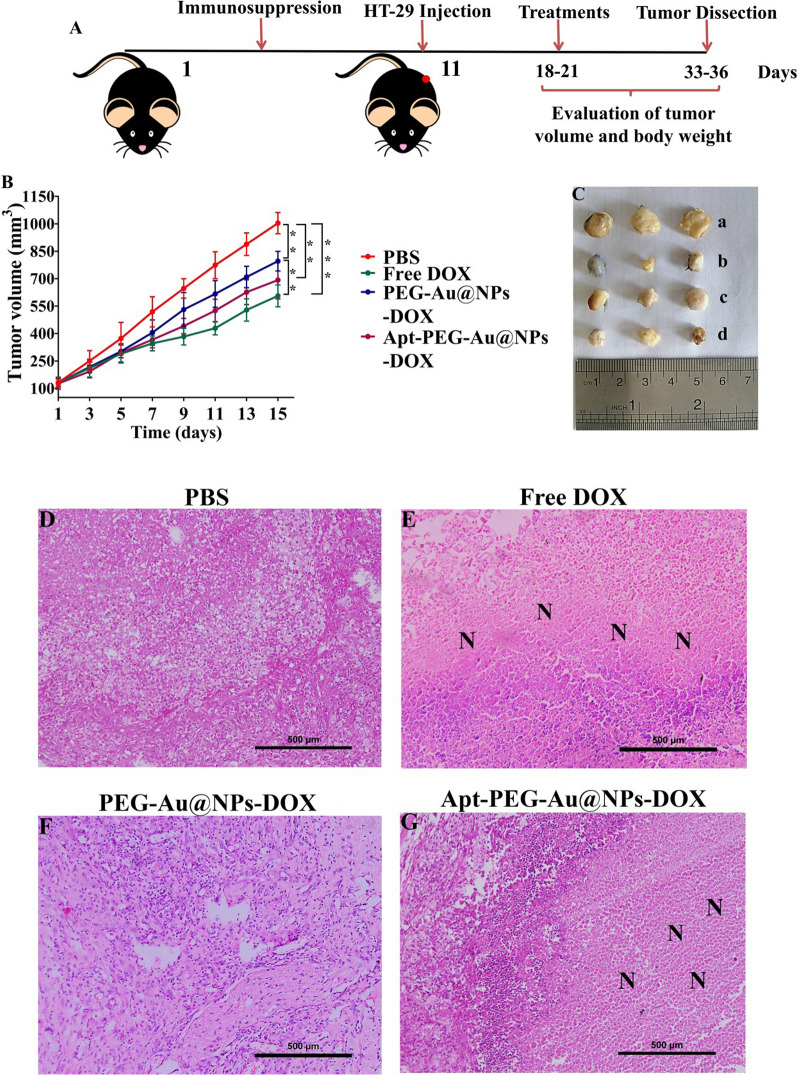
Fig. 6.
In vivo anti-tumor evaluation of free DOX, PEG-Au-NPs@DOX and Apt-PEG-Au-NPs@DOX (DOX final concentration was 1 μg/ml) in C57BL/6 mice bearing HT-29 tumors. A Schematic illustration of the therapy regimen. B Tumor growth curves showed strongest inhibition of free DOX and Apt-PEG-Au-NPs@DOX. Data are expressed as mean ± SD, n = 5. ** p < 0.01 and *** p < 0.001. C Tumor images in different experimental groups of (a) PBS, (b) free DOX, (c) PEG-Au-NPs@DOX and (d) Apt-PEG-Au-NPs@DOX treatments at day 15 post treatment. D H&E staining of tumor tissues indicated high levels of necrotic cells in both free DOX and targeted nanocarries. Scale bar = 50 μm. “N” represents necrotic areas within the tumor mass. SPION Superparamagnetic iron oxide nanoparticle, MSN Mesoporous silica nanoparticle, PEG Polyethylene glycol, NP nanoparticle, Apt Aptamer, DOX Doxorubicin, H&E Hematoxylin and eosin

