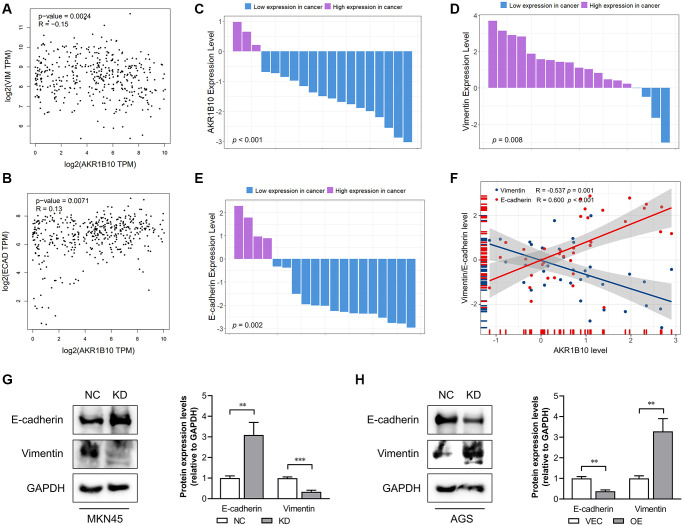
Figure 5.
Correlation between AKR1B10 and epithelial-mesenchymal transition. (A) Correlation analysis of AKR1B10 and Vimentin gene expression levels in gastric cancer (GC) patients by the GEPIA platform. (B) Correlation analysis of AKR1B10 and E-cadherin gene expression levels in GC patients by the GEPIA platform. (C–E) Comparison of AKR1B10 (C), Vimentin (D) and E-cadherin (E) mRNA levels in 19 paired GC and normal tissues. (F) Correlation between AKR1B10 and Vimentin, and between AKR1B10 and E-cadherin mRNA levels in GC tissues. (G) MKN45 cells transfected with NC or KD and (H) AGS transfected with VEC or AKR1B10-OE. The bands were semi-quantified by ImageJ and the results are presented as the mean ± SD. VIM, Vimentin; ECAD, E-cadherin; TPM, transcripts per million. NC, negative control; KD, knockdown; VEC, vector; OE, overexpression. **P < 0.01, ***P < 0.001.

