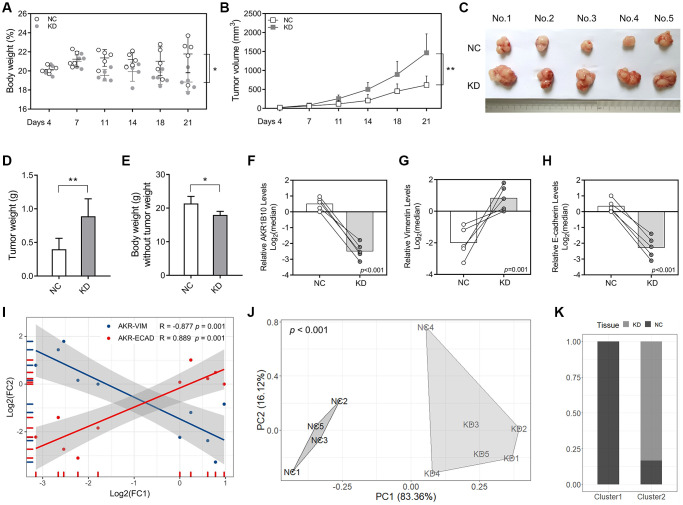
Figure 6.
AKR1B10 knockdown promotes gastric cancer tumor growth in vivo. (A–B) Total body weight (A) and tumor volume (B) of the mice. (C) Representative pictures of subcutaneous tumors harvested from NC and AKR1B10-KD group. (D) The weights of tumor masses. (E) The weights of mice without tumor masses. (F–I) Relative AKR1B10 (F), Vimentin (G) and E-cadherin (H) mRNA levels in tumors of the AKR1B10-KD or NC group, and their correlation (I). (J) Stratification of mice into cluster 1 and cluster 2 according to AKR1B10 mRNA levels, body weight and tumor weight. (K) Percentage of NC and AKR1B10-KD mice in each cluster. Data are presented as the mean ± SD. NC, negative control; KD, AKR1B10 knockdown. *P < 0.05, **P < 0.01.

