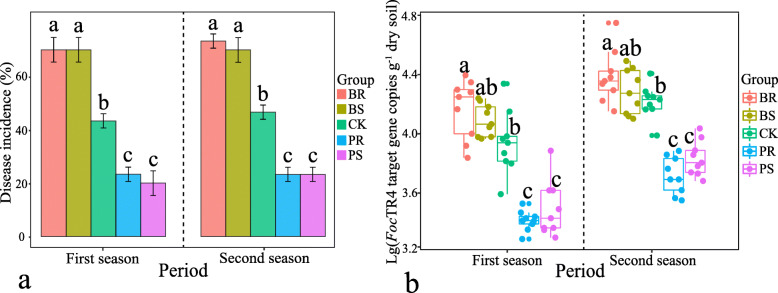
Fig. 1.
a Bar chart displaying the incidence (in %) of the Fusarium wilt disease in each treatment at two independent experiments (indicated as first and second seasons). b Copy numbers of FocTR4 target gene copies (qPCR) per gram of dry weight soil. Data are shown per each treatment at two independent experiments (indicated as first and second seasons). BS above-ground banana residue; BR, below-ground banana residue; PS, above-ground pineapple residue; PR, below-ground pineapple residue; and CK, control treatment without residue. Different lowercase letters indicate statistically significant differences (P < 0.05) according to Tukey’s HSD test

