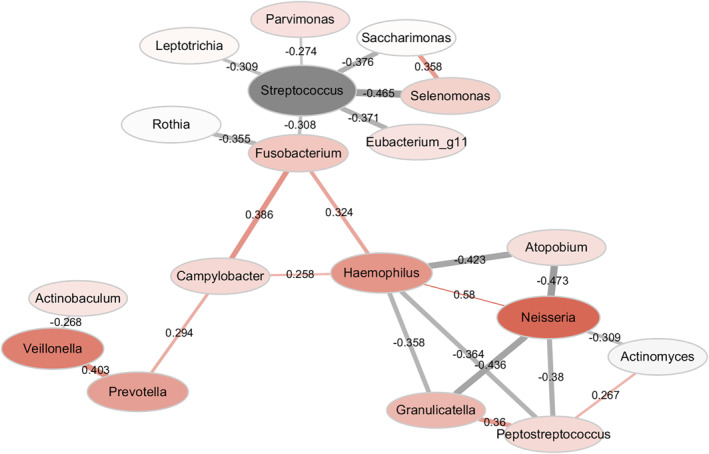
FIGURE 3.

Network analysis of microbiota in asthma exacerbation. Node size is proportional to the mean relative abundance. Node colour (red represents increased microbiota and grey represents decreased microbiota in asthma exacerbation) and node hue is proportional to the difference in microbiota relative abundance between asthma exacerbation and stable asthma. Each edge: a significant correlation coloured to indicate either positivity (red) or negativity (grey). Edge width and transparency are proportional to the absolute value of the correlation coefficient. Correlations were determined with SparCC with a correlation cut‐off R value of greater than 0.25 or less than −0.25
