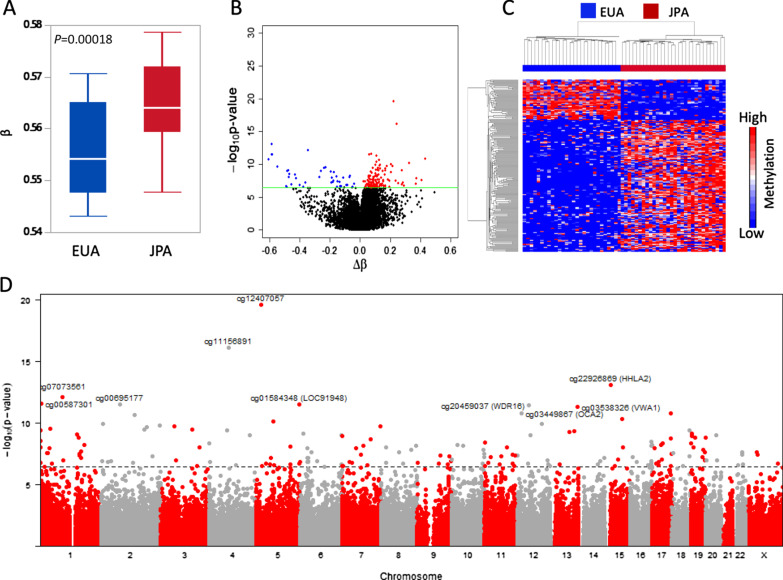
Fig. 1.
Global DNA methylation and 285,457 differentially methylated CpGs between JPA and EUA. A A box plot of global DNA methylation (mean methylation of 285,457 DM-CpGs) between JPA (red) and EUA (blue). B A volcano plot for all 285,457 CpGs showing differences in mean methylation (Δβ = Avg Methylation JPA—Avg Methylation EUA) (x-axis) and –log10P-value (y-axis). The green line indicates the Bonferroni-adjusted P-value < 0.1 cutoff. The red points correspond to significantly DM-CpGs that are hypermethylated in JPA relative to EUA, while the blue points correspond to DM-CpGs that are hypermethylated in EUA compared to JPA. C Hierarchal clustering of the 174 significantly DM-CpGs (rows) and samples (columns). Red corresponds to higher methylation, while blue corresponds to lower methylation. D A Manhattan plot showing the significance of association by chromosome, with the top 10 DM-CpGs by P-value labeled. The dotted line indicates the Bonferroni-adjusted P-value < 0.1 cutoff

