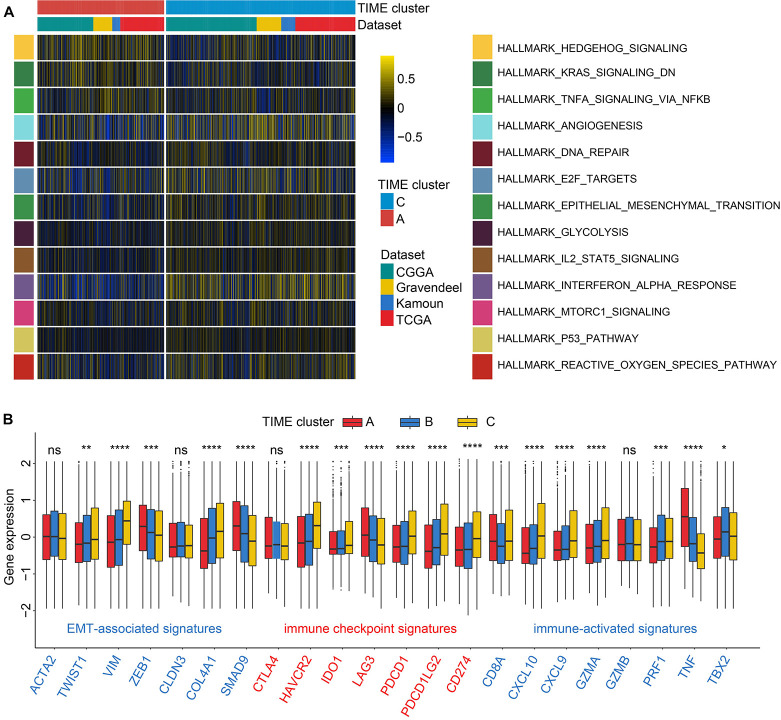
FIGURE 2.
Enrichment analysis and association of transcriptome traits and TIME phenotypes in the Chinese Glioma Genome Atlas (CGGA) cohort. (A) Gene set variation analysis (GSVA) revealed P53 and IL2-STAT3 signaling pathways were enriched in TIME cluster C; and TNFA via NFκB signaling pathway and downregulation of kirsten rat sarcoma viral oncogen (KRAS) were enriched in TIME cluster A. Color represents pathway enrich scores: color blue refers to high score and yellow low. (B) TIME patterns were discriminated by distinct expression levels of signatures related to epithelial–mesenchymal transition (EMT), immune checkpoint, and immune activation by the Kruskal–Wallis test. ns, p > 0.05; *p < 0.05; **p < 0.01; ***p < 0.001; and ****p < 0.0001.

