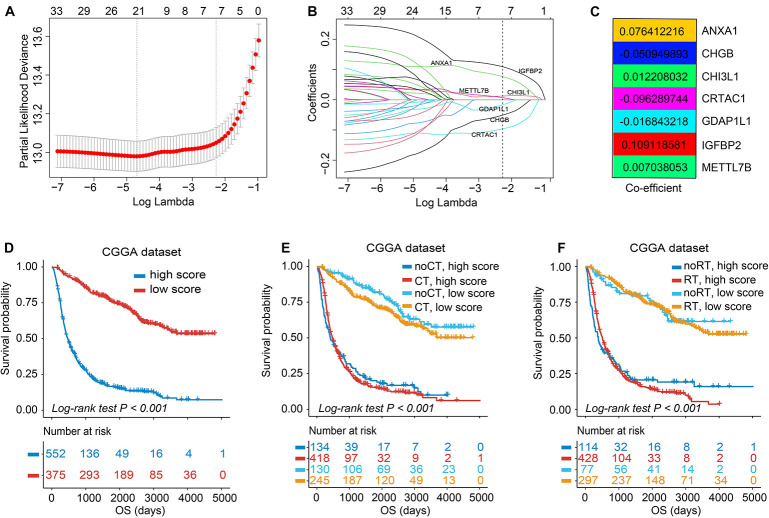
FIGURE 3.
Feature selection using least absolute shrinkage and selection operator (LASSO)–Cox regression and establishment of TIMEscore. (A) Tuning parameter selection (λ) in the LASSO–Cox model used 10-fold cross-validation via minimum criteria. Dotted vertical lines were drawn at the optimal values by using the minimum criteria and the 1 standard error of the minimum criteria (the 1 – SE criteria). λ value of 0.103, with log (λ); –2.273 was chosen (1 – SE criteria) based on 10-fold cross-validation. (B) A coefficient profile plot of LASSO–Cox coefficient profiles of the 33 variates. (C) Heatmap of coefficients calculated from LASSO–Cox analysis of seven mRNAs. (D) K-M curve of survival differences between high and low TIMEscore groups, in CGGA sets. (E,F) K-M curve of survival differences between high and low TIMEscore groups when receiving adjuvant chemotherapy (E) and radiotherapy (F).

