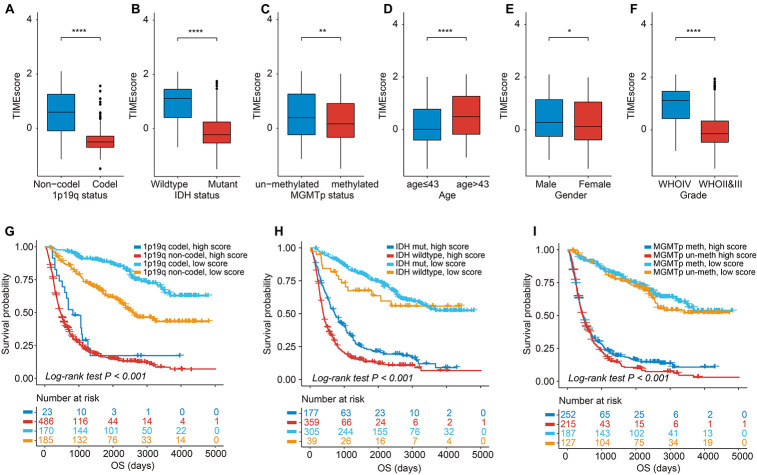
FIGURE 5.
Association of TIMEscore and glioma clinicopathologic features. (A–F) Barplot of TIMEscore in groups with different clinicopathologic characteristics in CGGA set, compared with the Wilcoxon test. (G–I) K-M curves for patients with glioma in the CGGA cohort stratified by 1p19q codeletion status (G), isocitrate dehydrogenase (IDH) mutation status (H), O6-methylguanine-DNA methyltransferase (MGMT) methylation status (I), and TIMEscore. *p < 0.05; **p < 0.01; ***p < 0.001; and ****p < 0.0001.

