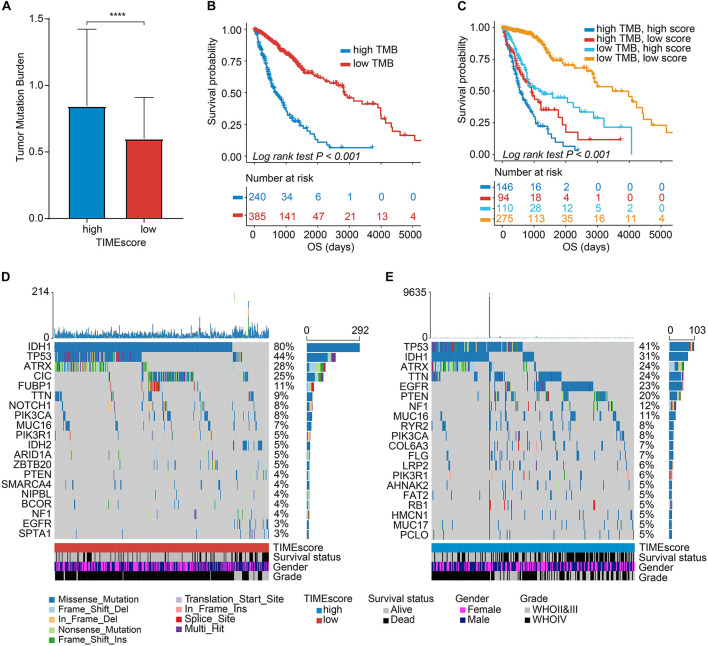
FIGURE 7.
Correlation between the TIMEscore and somatic variants. (A) Tumor mutation burden (TMB) differences in the high and low TIMEscore subgroups. Wilcoxon test, p < 0.0001. (B) K-M curves for high and low TMB groups of TCGA glioma cohort. (C) K-M curves for patients in TCGA glioma cohort stratified by both TMB and TIMEscore. (D,E) The oncoPrint was constructed using low TIMEscore on the left (D) and high TIMEscore on the right (E). The columns represent samples. *p < 0.05; **p < 0.01; ***p < 0.001; and ****p < 0.0001.

