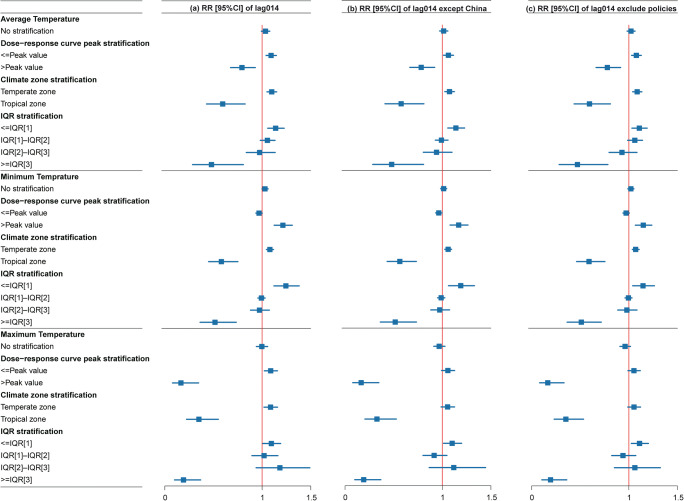
Fig. 4.
The pooled results of temperature on daily new cases of COVID-19 in 153 countries and 31 provinces of mainland China at lag014 (a), except China at lag014 (b), and excluded policies at lag014 (c) by different stratifications. Note: IQR: interquartile range. The peak values of the smoothing plot, IQR [1], IQR [2] and IQR [3] of the average temperature were 17.5°C, 8.57°C, 16.21°C, and 26.55°C, respectively; The peak values of the smoothing plot, IQR [1], IQR [2], and IQR [3] of the minimum temperature were 12.5°C, 4.69°C, 12.70°C, and 21.38°C, respectively; The peak values of the smoothing plot, IQR [1], IQR [2], and IQR [3] of the maximum temperature were 22.5°C, 12.22°C, 20.84°C, and 30.82°C, respectively

