Figure 2.

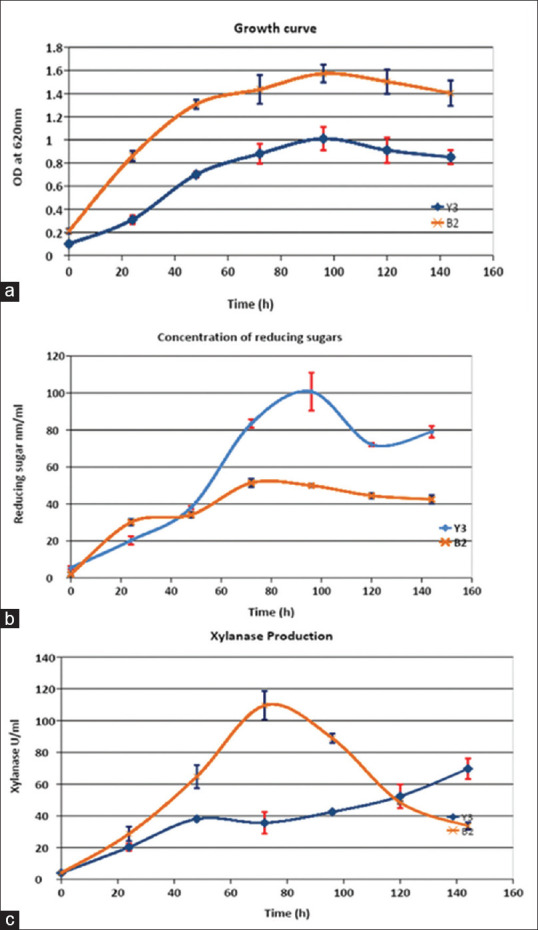
(a) Growth curves of isolates Y3 and B2, (b) concentration of residual reducing sugars, (c) time course of xylanase production by isolates Y3 and B2 (original work)

(a) Growth curves of isolates Y3 and B2, (b) concentration of residual reducing sugars, (c) time course of xylanase production by isolates Y3 and B2 (original work)