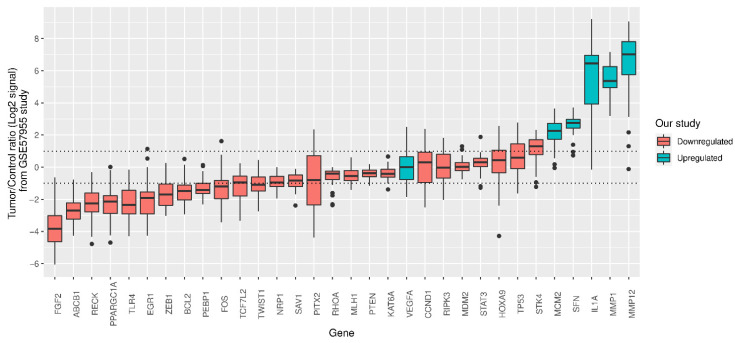
Figure 3.
Gene expression ratios of log2 signal between penile cancer samples (n = 39) and a pool of five autopsy glans (control group) from the GSE57955 dataset. Thirty-two (out of 37) differentially expressed genes (DEGs) detected in our study were available in this dataset. All median values above 1.0 or below −1.0 were considered as differentially expressed in the GSE57955 study. Box plots for each gene were colored according to its regulation type in our study (red for downregulated genes and blue for upregulated genes). Five upregulated genes and ten downregulated genes from our study were confirmed in this dataset.

