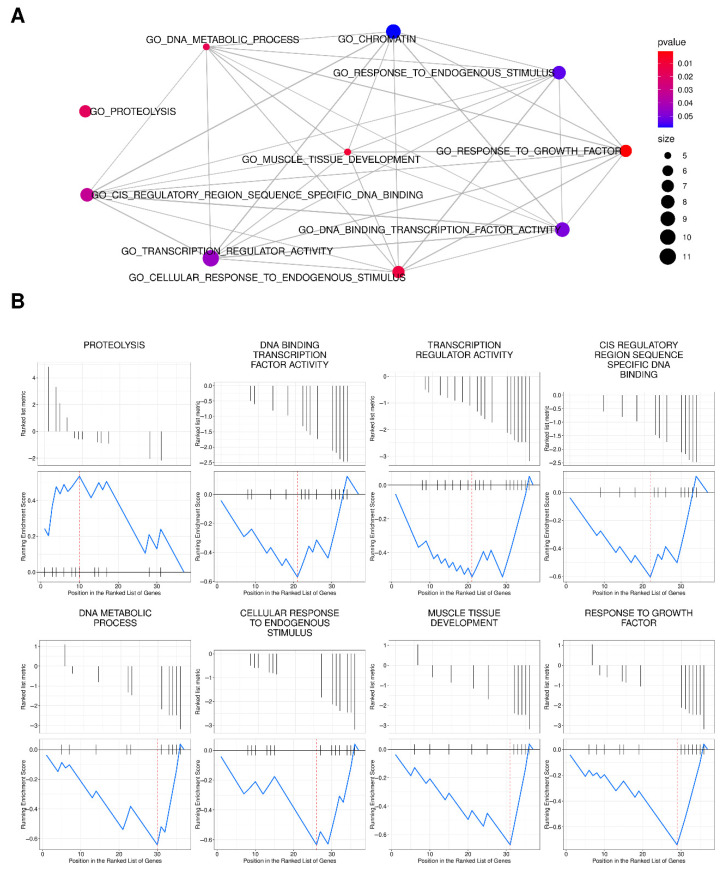
Figure 4.
Gene Set Enrichment Analysis (GSEA) for Differentially Expressed Genes (DEGs) in the Gene Ontology (GO) database. (A) Biological network of the most represented GO terms, including the 37 detected DEGs in our study. Plots are represented as linked dots colored by p-value and sized by the number of involved genes; (B) GSEA plots indicate the DEGs’ distribution for each pathway. Blue lines represent the fluctuation of the Enrichment Score for each selected pathway indicating which one was upregulated (above the horizontal black bar) or downregulated (below the horizontal black bar).

