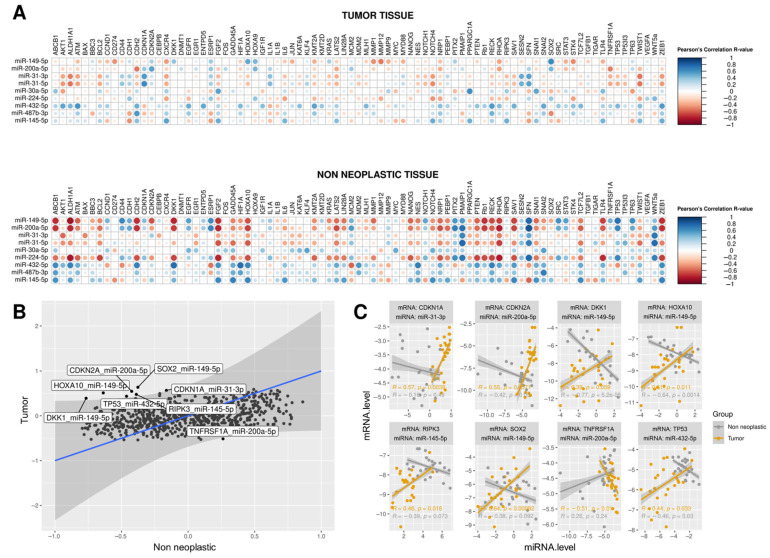
Figure 5.
Pair-wise correlations between expression levels of 9 miRNAs and 83 genes in tumor tissues (TT) and non-neoplastic tissues (NNT) considering the total sample of 24 PeC patients. (A) Pearson correlation coefficients between expression levels of miRNAs and genes showed different profiles across TT and NNT samples. The size and color of each dot represent the Pearson correlation R-values for each miRNA-mRNA pair; (B) R-values were plotted, and eight miRNA-mRNA pairs out of the confidence interval of the linear equation were labeled and selected for further analysis. Each axis represents the correlation R-value for a specific tissue (TT or NNT); (C) miRNA and gene expression values (-delta CT) of TT (n = 24) and NNT (n = 24) were plotted for the eight miRNA-mRNA pairs selected in (B). For each graph, the R coefficient and p values of the Pearson Correlation test are indicated at the bottom.

