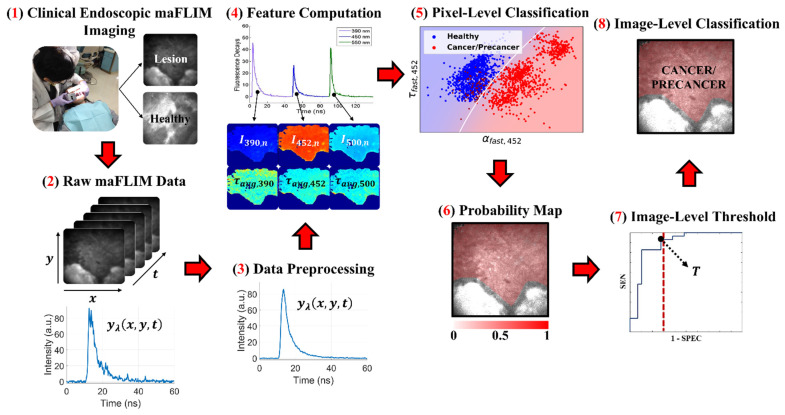
Figure 1.
Summary of the methods used in this study. (1) In vivo clinical maFLIM images of both the lesions and healthy tissue regions from oral cancer patients were acquired. (2,3) Raw maFLIM data were preprocessed to increase the signal quality. (4) Autofluorescence spectral and time-resolved maFLIM features were computed per pixel. (5) Models for the classification of precancer/cancer vs. healthy oral tissue at the pixel level were trained. (6) Pixel-level classification results in a posterior probability map for each imaged oral tissue region. (7) An image-level score was computed from the posterior probability map, and a threshold (T) on this score was optimized. (8) The image-level score threshold was applied to classify the whole image as either precancer/cancer or healthy. Note. Modified from “Clinical label-free biochemical and metabolic fluorescence lifetime endoscopic imaging of precancerous and cancerous oral lesions,” by Duran-Sierra, E.; Cheng, S.; Cuenca-Martinez, R.; Malik, B.; Maitland, K.C.; Lisa Cheng, Y.S.; Wright, J.; Ahmed, B.; Ji, J.; Martinez, M.; et al., 2020, Oral Oncol, p. 2, doi:10.1016/j.oraloncology.2020.104635 [20].

