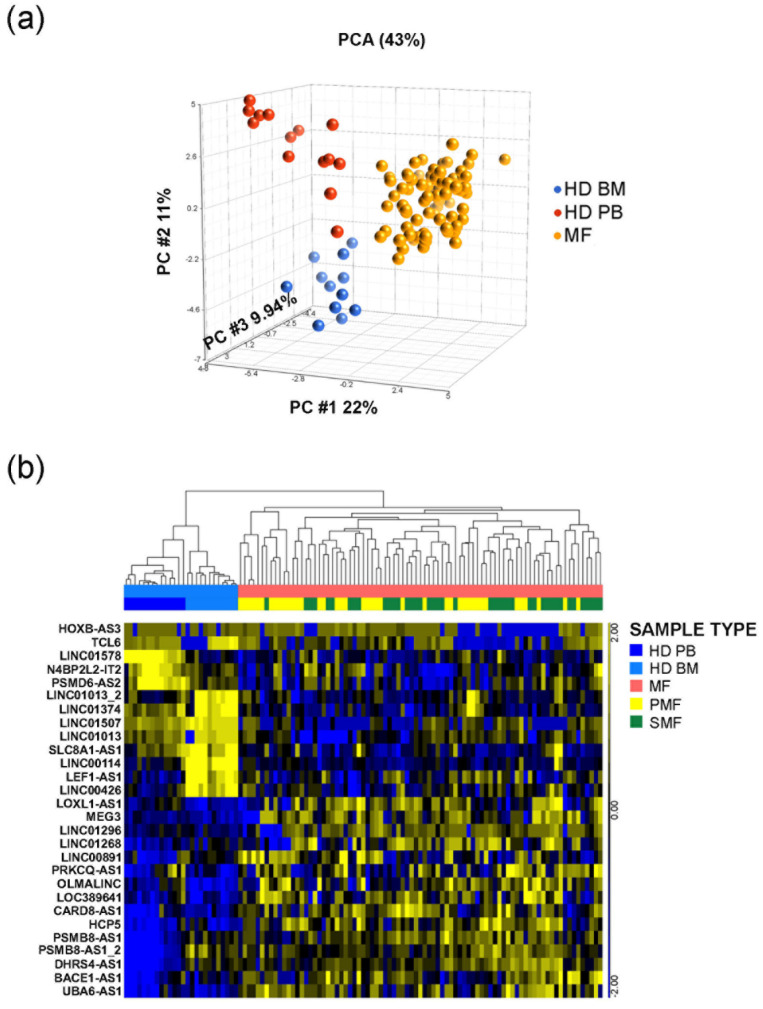
Figure 1.
PCA and Hierarchical clustering of OpenArray Data. (a) PCA graph represents the global lncRNAs expression in CD34+ stem/progenitor cells. (b) Hierarchical clustering of samples according to the expression of 28 lncRNA transcripts, corresponding to 26 lncRNAs. Both analyses were performed by Partek GS, version 6.6. FDR = False Discovery Rate; BM = control samples isolated from bone marrow; PB = control samples isolated from peripheral blood; HD = healthy donor; MF = myelofibrosis patients; PMF = primary myelofibrosis; SMF = secondary myelofibrosis.

