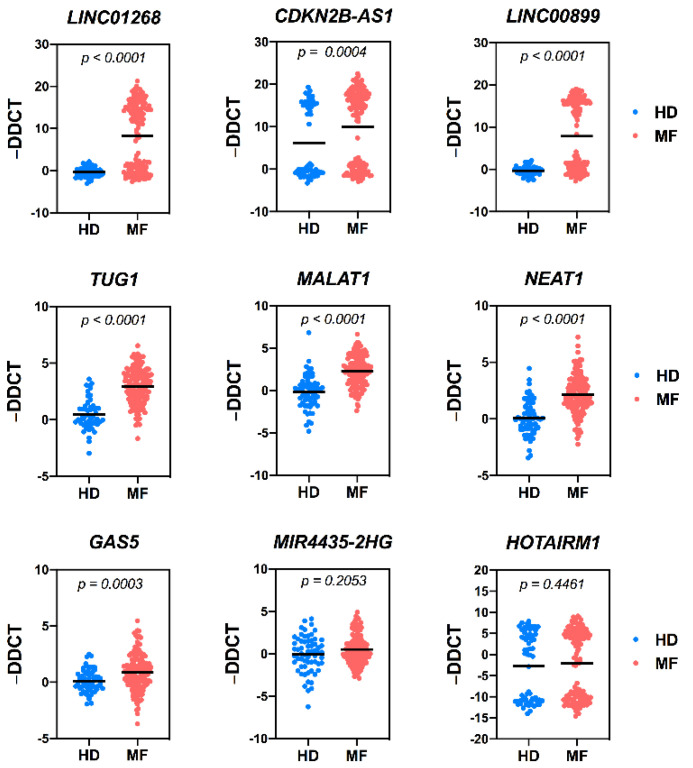
Figure 2.
Circulating levels of lncRNAs in HD and MF samples. Scatter dot plots represent the circulating plasma levels of selected lncRNAs in control (HD) and MF samples. Data are expressed as −ΔΔCT using H19 lncRNA as endogenous control and the median ΔCT of the group of control samples as calibrator. Control samples are represented by blue dots, whereas MF sample by red dots. The black horizontal line in middle represents the median value. p = p-value computed by non-parametric Mann–Whitney U test. N = 65 for control samples; n = 143 for MF samples. HD = healthy donor, MF = myelofibrosis samples.

