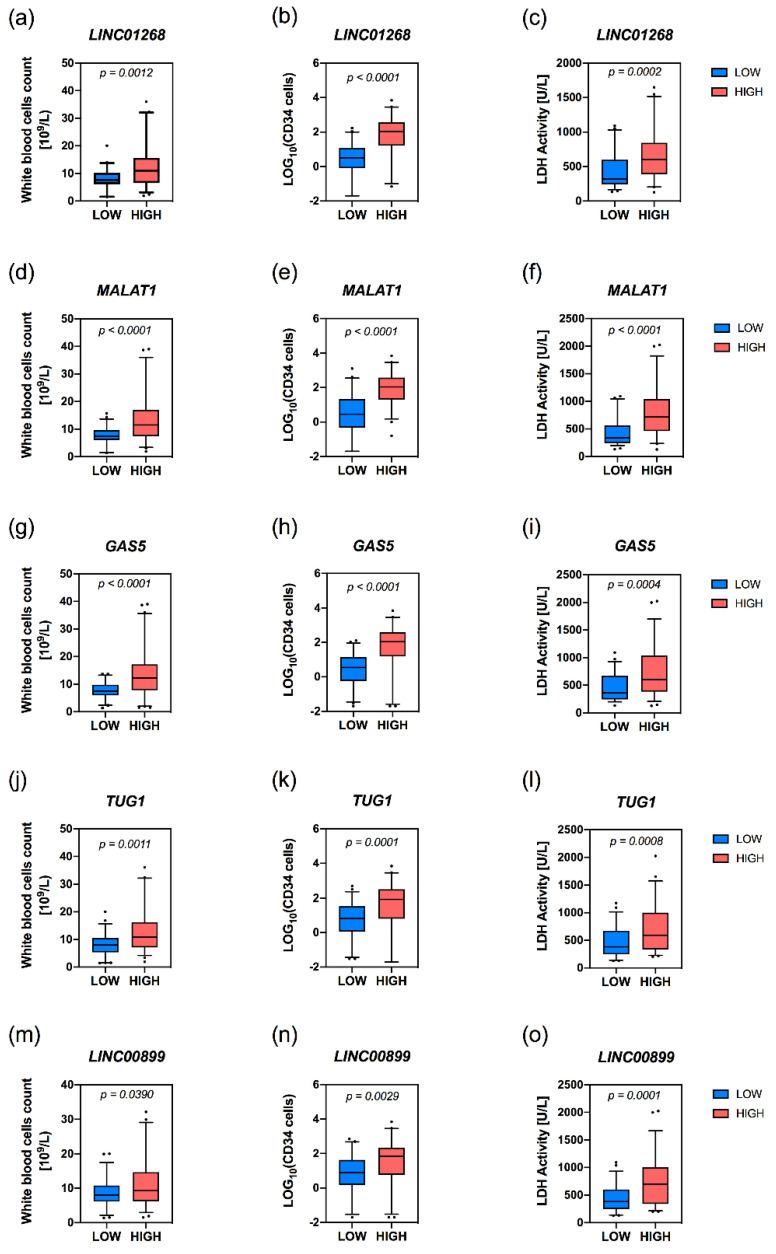
Figure 3.
Correlation analysis of level of circulating lncRNAs with WBC count, circulating CD34+ count and LDH activity in MF patients. Box plots represent values from white blood cell count (WBC) (a,d,g,j,m), CD34+ cells count (b,e,h,k,n) and LDH activity (c,f,i,l,o) in MF samples presenting low or high levels of target RNA. The box extends from the 25th to the 75th percentiles. The line in middle of the box is plotted as the median. The whiskers are drawn as 5th and 95th percentiles. Values above or below the whiskers are plotted as individual points. Samples with low or high levels of target lncRNA are represented by blue and red boxes, respectively. p = p-value was computed by non-parametric Mann–Whitney U test.

