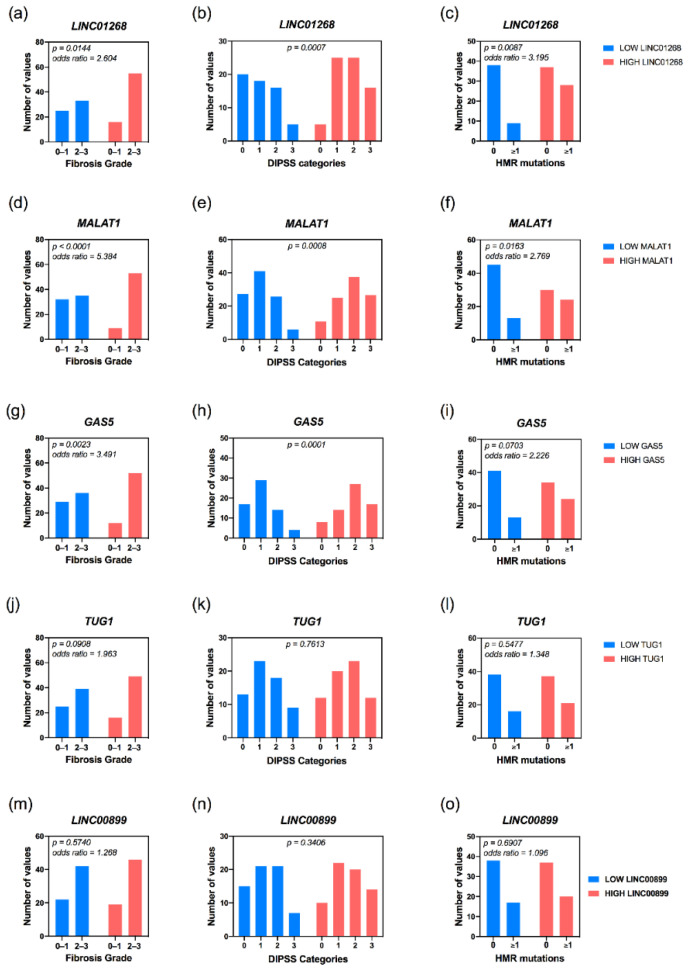
Figure 4.
Correlation analysis of level of circulating lncRNAs with fibrosis and mutational status of MF patients. Histograms obtained from contingency tables computed to correlate lncRNAs plasma levels and prognostic estimates such as fibrosis grade (a,d,g,j,m), assignment to DIPSS categories (b,e,h,k,n) and HMR mutations (c,f,i,l,o). Samples with low or high levels of target RNA are represented in blue and red, respectively. p = p-value was computed by Fisher’s exact test or the Chi-square (χ2) test.

