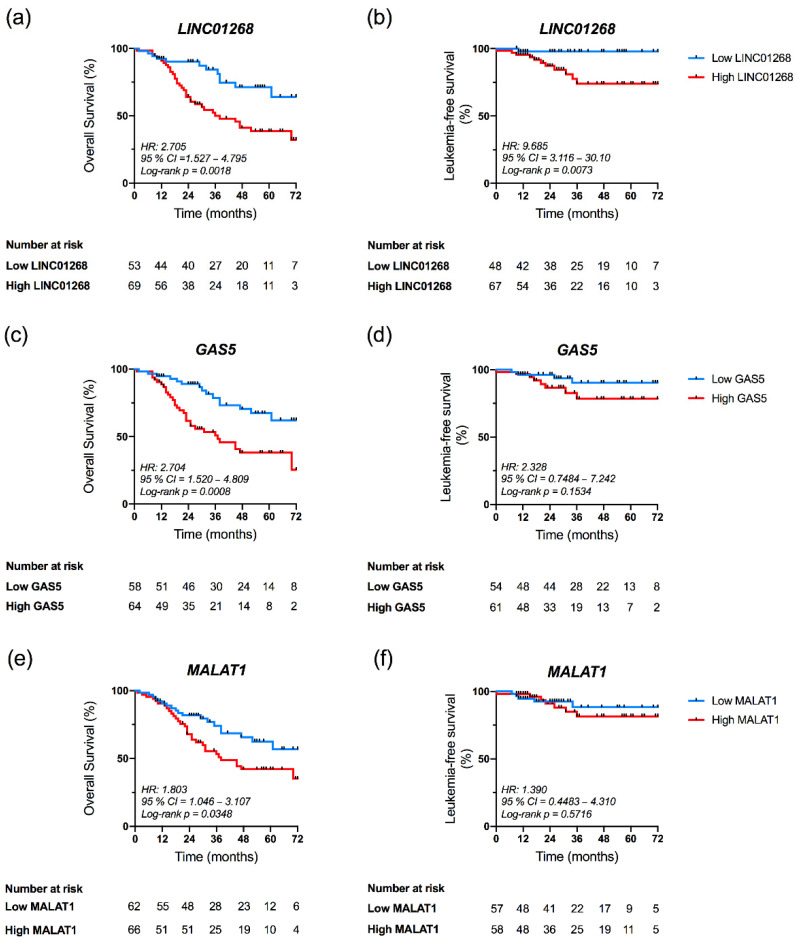
Figure 5.
Kaplan–Meier analysis of Overall Survival (OS) and Leukemia-free Survival (LFS) according to LINC01268, GAS5 and MALAT1 plasma levels. Kaplan–Meier estimates of OS (a,c,e) and LFS (b,d,f) of MF patients in the study. Patients’ cohort was stratified into two groups (low and high) according to the plasma levels of target lncRNA, as described in the text. Differences between two survival curves was evaluated by Log-rank (Mantel–Cox) test. Blue and red curves represent patients with low or high levels of circulating target, respectively. HR = hazard ratio computed to determine the magnitude of differences between two curves; p-value was computed by log-rank test; 95% CI = 95% confidence interval.

