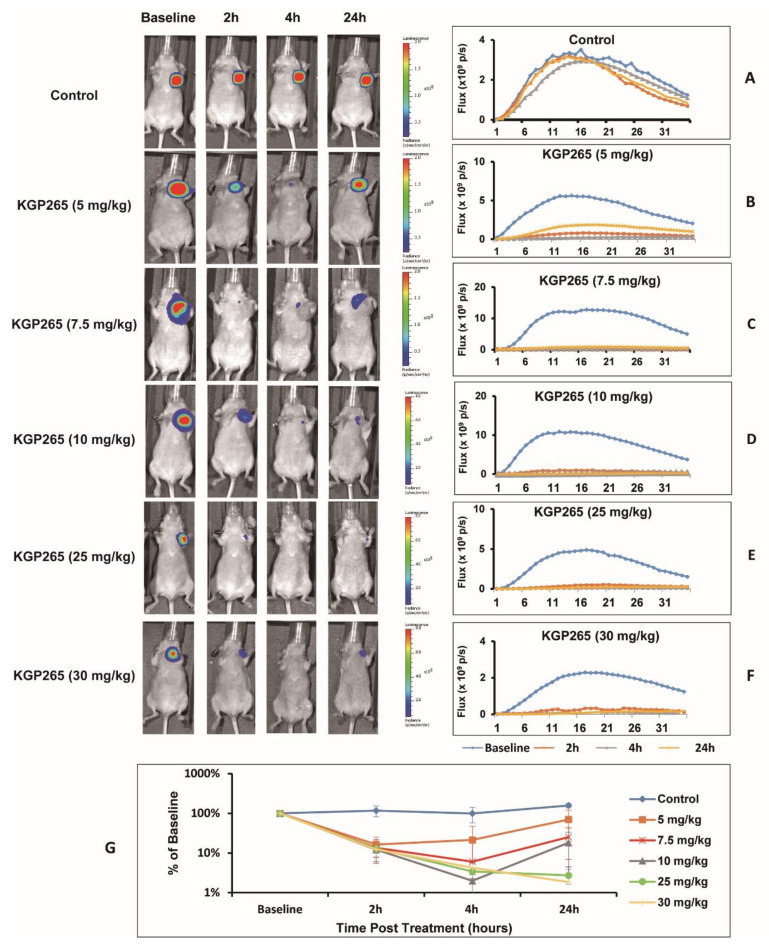
Figure 3.
BLI observations of the MDA-MB-231-luc tumor dose response to KGP265. (Left) BLI signal intensity images overlaid as heat maps on gray-scale photographs of nude mice at about 12 min following the administration of luciferin at selected time points following the administration of various doses of KGP265. All intensity maps have the same heat scale. (Right) Corresponding BLI intensity curves for the respective individual mice on the left showing differential variations over a period of 35 min following the administration of luciferin at the baseline (blue), 2 h (orange), 4 h (grey) and 24 h (yellow) following each of the doses of KGP265: (A) saline control, (B) 5 mg/kg, (C) 7.5 mg/kg, (D) 10 mg/kg, (E) 25 mg/kg, (F) 30 mg/kg and (G) KGP265 dose response comparisons. Relative signals indicating differential dose responses over a period of 24 h following the administration of different doses of KGP265 to MDA-MB-231-luc tumor-bearing nude mice: saline control (n = 5, blue diamond), 5 mg/kg (n = 5, orange square), 7.5 mg/kg (n = 5, red asterisk), 10 mg/kg (n = 6, grey triangle), 25 mg/kg (n = 4, green circle) and 30 mg/kg (n = 6, yellow cross). Individual data points represent the mean ± SD.

