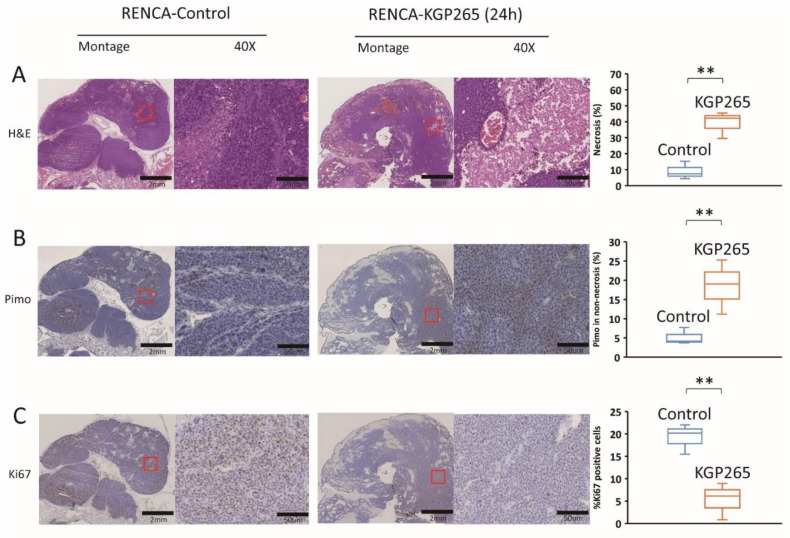
Figure 8.
Histological analysis of IHC staining of RENCA tumors in response to KGP265. (A) H&E staining shows differences between the control and KGP265-treated RENCA tumor tissues. (B) IHC images of RENCA tumor tissue sections, and graphs showing the levels of pimonidazole in the control and KGP265-treated tumors. (C) Representative IHC images of RENCA tumor tissue sections, and graphs showing the levels of Ki67 in the control and KGP265-treated tumors. The red rectangles in the montages show the regions in 40× magnified images. Scale bar: montage, 2 mm; 40×, 50 µm. The staining levels were quantified, and the data are plotted as the mean ± SEM. The values shown in the graphs are averages of the signals quantified from three independent tumors in the IHC experiments. For the statistical analysis, the levels in the treated tumors were compared to the levels in the control tumors with an unpaired t-test. ** p < 0.01.

