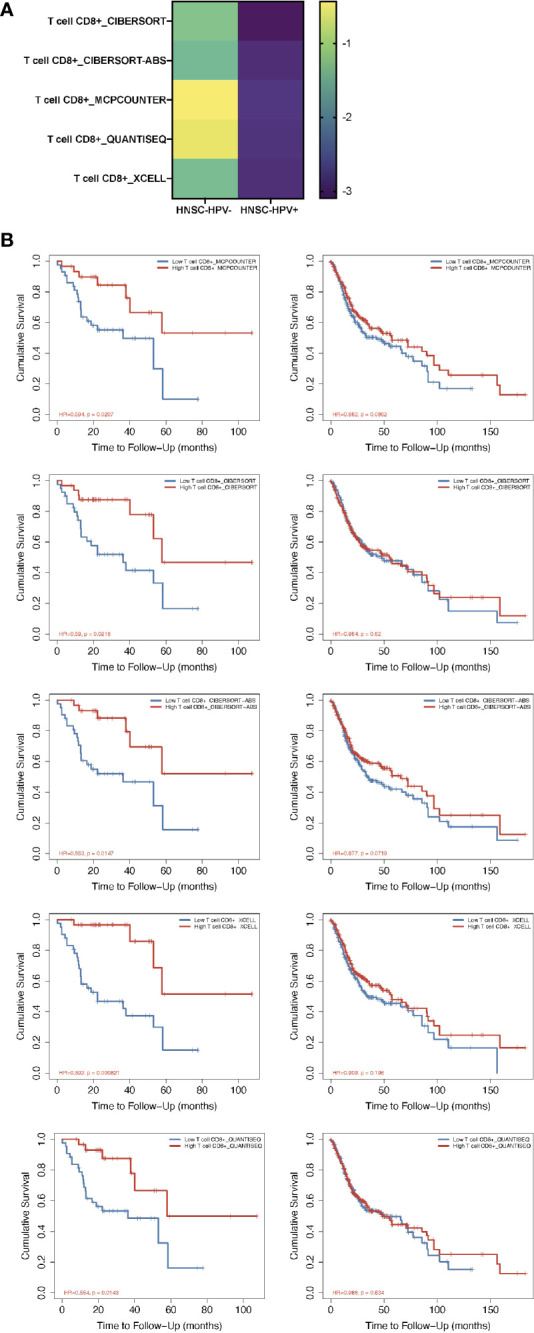
Figure 1.

Prognosis-correlated data of CD8+ T cells from patients with HPV− and HPV+ HNSCC. (A) A heat map of data from the multiple-variate Cox proportional risk model in terms of CD8+ T cells from patients with HPV− versus HPV+ HNSCC. The z-scores represent the risk scores. (B) Kaplan-Meier survival analysis showing the levels of CD8+ T cells from patients with HPV− (right column) and HPV+ (left column) HNSCC by using MCPcounter, CIBERSORT, CIBERSORT-ABS, XCELL and QUANTISEQ approaches.
