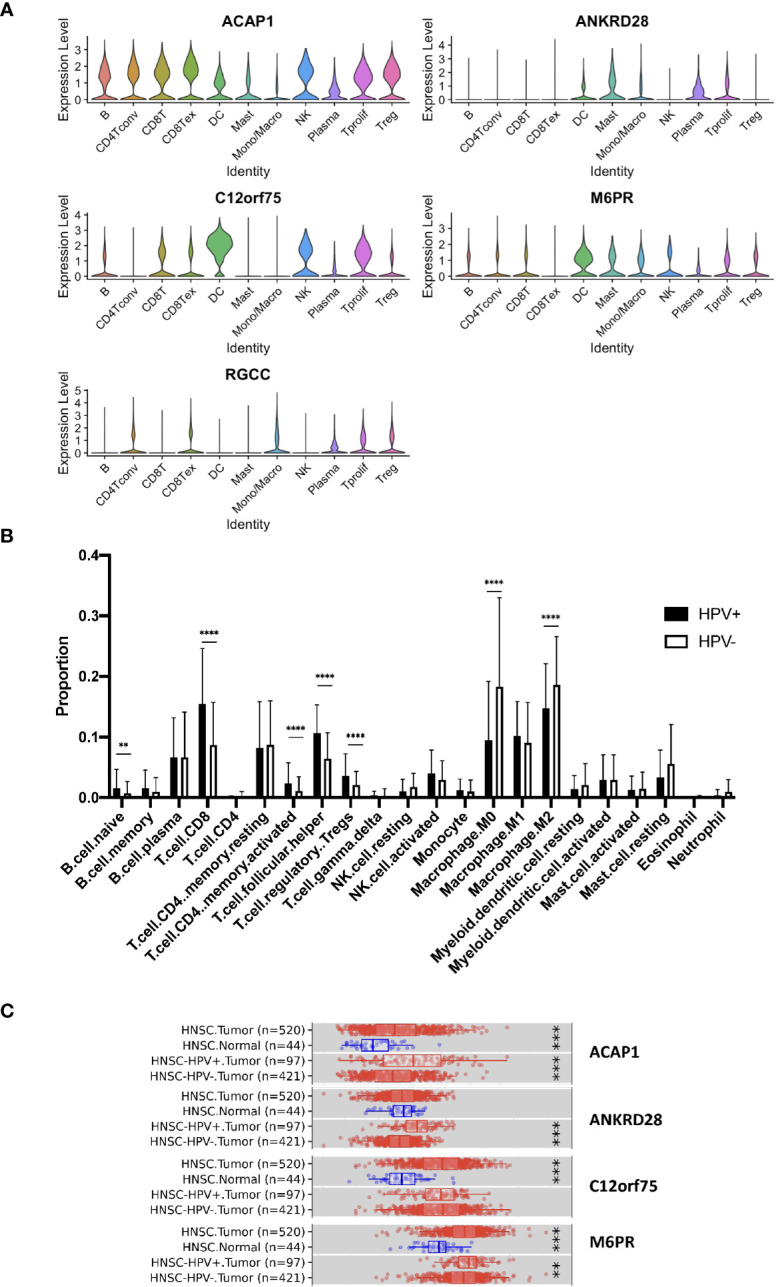
Figure 4.

Expression of the signature genes. (A) Violin plots illustrating the expression of the survival related signature genes in different TIL cell types of scRNA data. (B) Bulk seq data were deconvoluted using CIBERSORT method. Bar graph illustrating the proportion of infiltrated immune cells of HPV+ and HPV− HNSCC. (C) Expression of signature genes were analyzed using TIMER2 website. Box charts showed the expression of the signature genes of the TCGA data. “**” refers p < 0.01, “***” refers p < 0.001 and “****” refers p < 0.0001.
