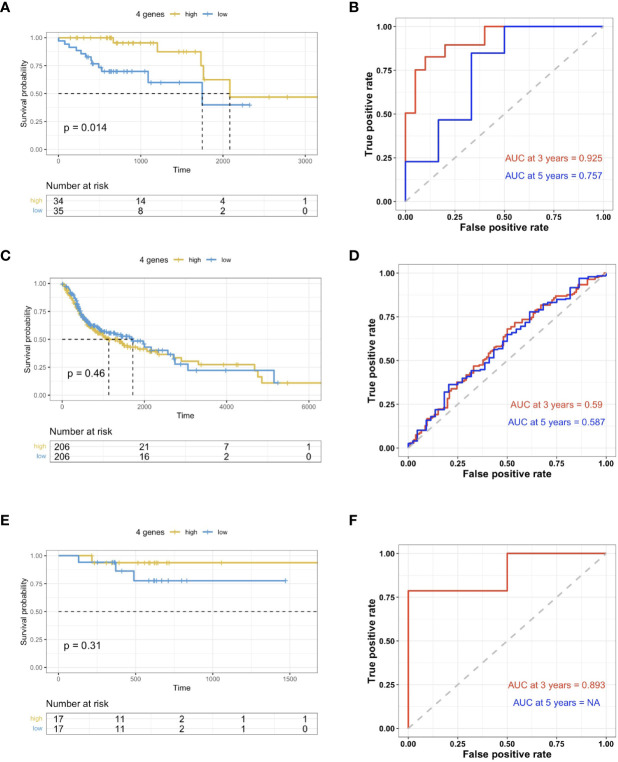
Figure 5.
Validation of prognosis gene labels for HNSCC cases. (A) Kaplan-Meier (KM) analysis of the risk group that were defined with CD8+ T cell-correlated gene tags in the TCGA dataset for HPV+ HNSCC. (B) KM analysis of the risk group that were defined with CD8+ T cell-correlated gene tags in the TCGA dataset for HPV- HNSCC. (C) KM analysis of the risk group that were defined with CD8+ T cell-correlated gene tags in the TCGA provisional dataset for HPV+ HNSCC. (D) Three- and five-year ROC survival curves from the TCGA dataset for HPV+ HNSCC. (E) Three- and five-year ROC survival curves from the HPV- HNSCC TCGA dataset. (F) Three- and five-year ROC survival curves from the TCGA provisional dataset for HPV+ HNSCC.

