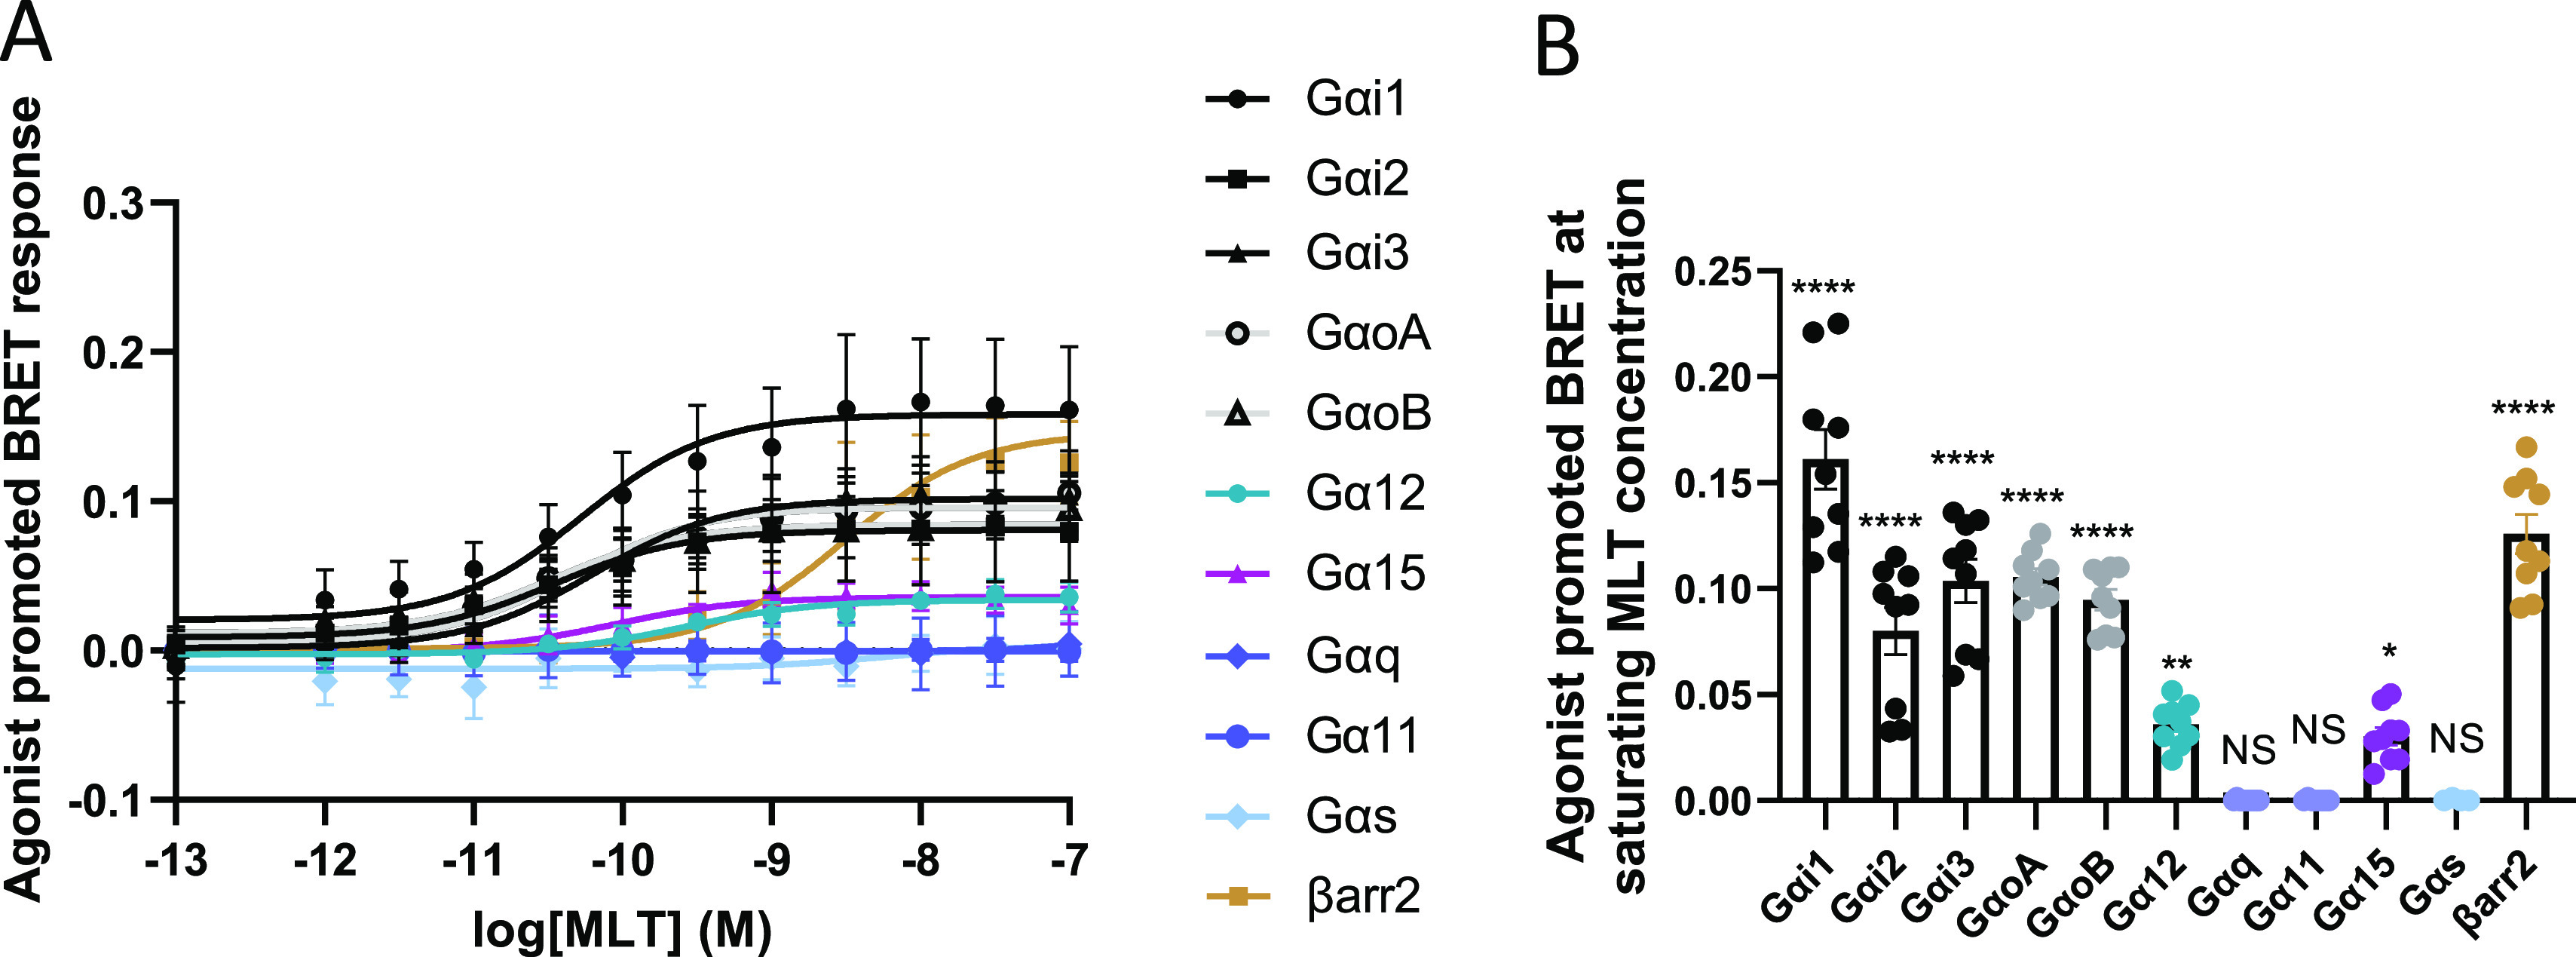
Figure 1.

MT1-WT activates Gαi/o, Gα12, Gα15, and recruits βarrestin-2. (A) MLT concentration curves for MT1-WT. Data were plotted using nonlinear regression curves with a fixed Hill slope equal to 1. (B) MT1 response for Gαi1, Gαi2, Gαi3, GαoA, GαoB, Gα12, Gαq, Gα11, Gα15, and Gαs activation and βarrestin-2 recruitment at saturated MLT concentration (100 nM) of the corresponding curves in A. Statistical analysis was performed using one-way ANOVA followed by a Dunnett’s posthoc test. Data represents the mean ± SEM of 5 to 9 experiments. Data were fitted in GraphPad Prism 9. * p ≤ 0.05, ** p ≤ 0.01, **** p ≤ 0.0001. βarr2: βarrestin-2.
