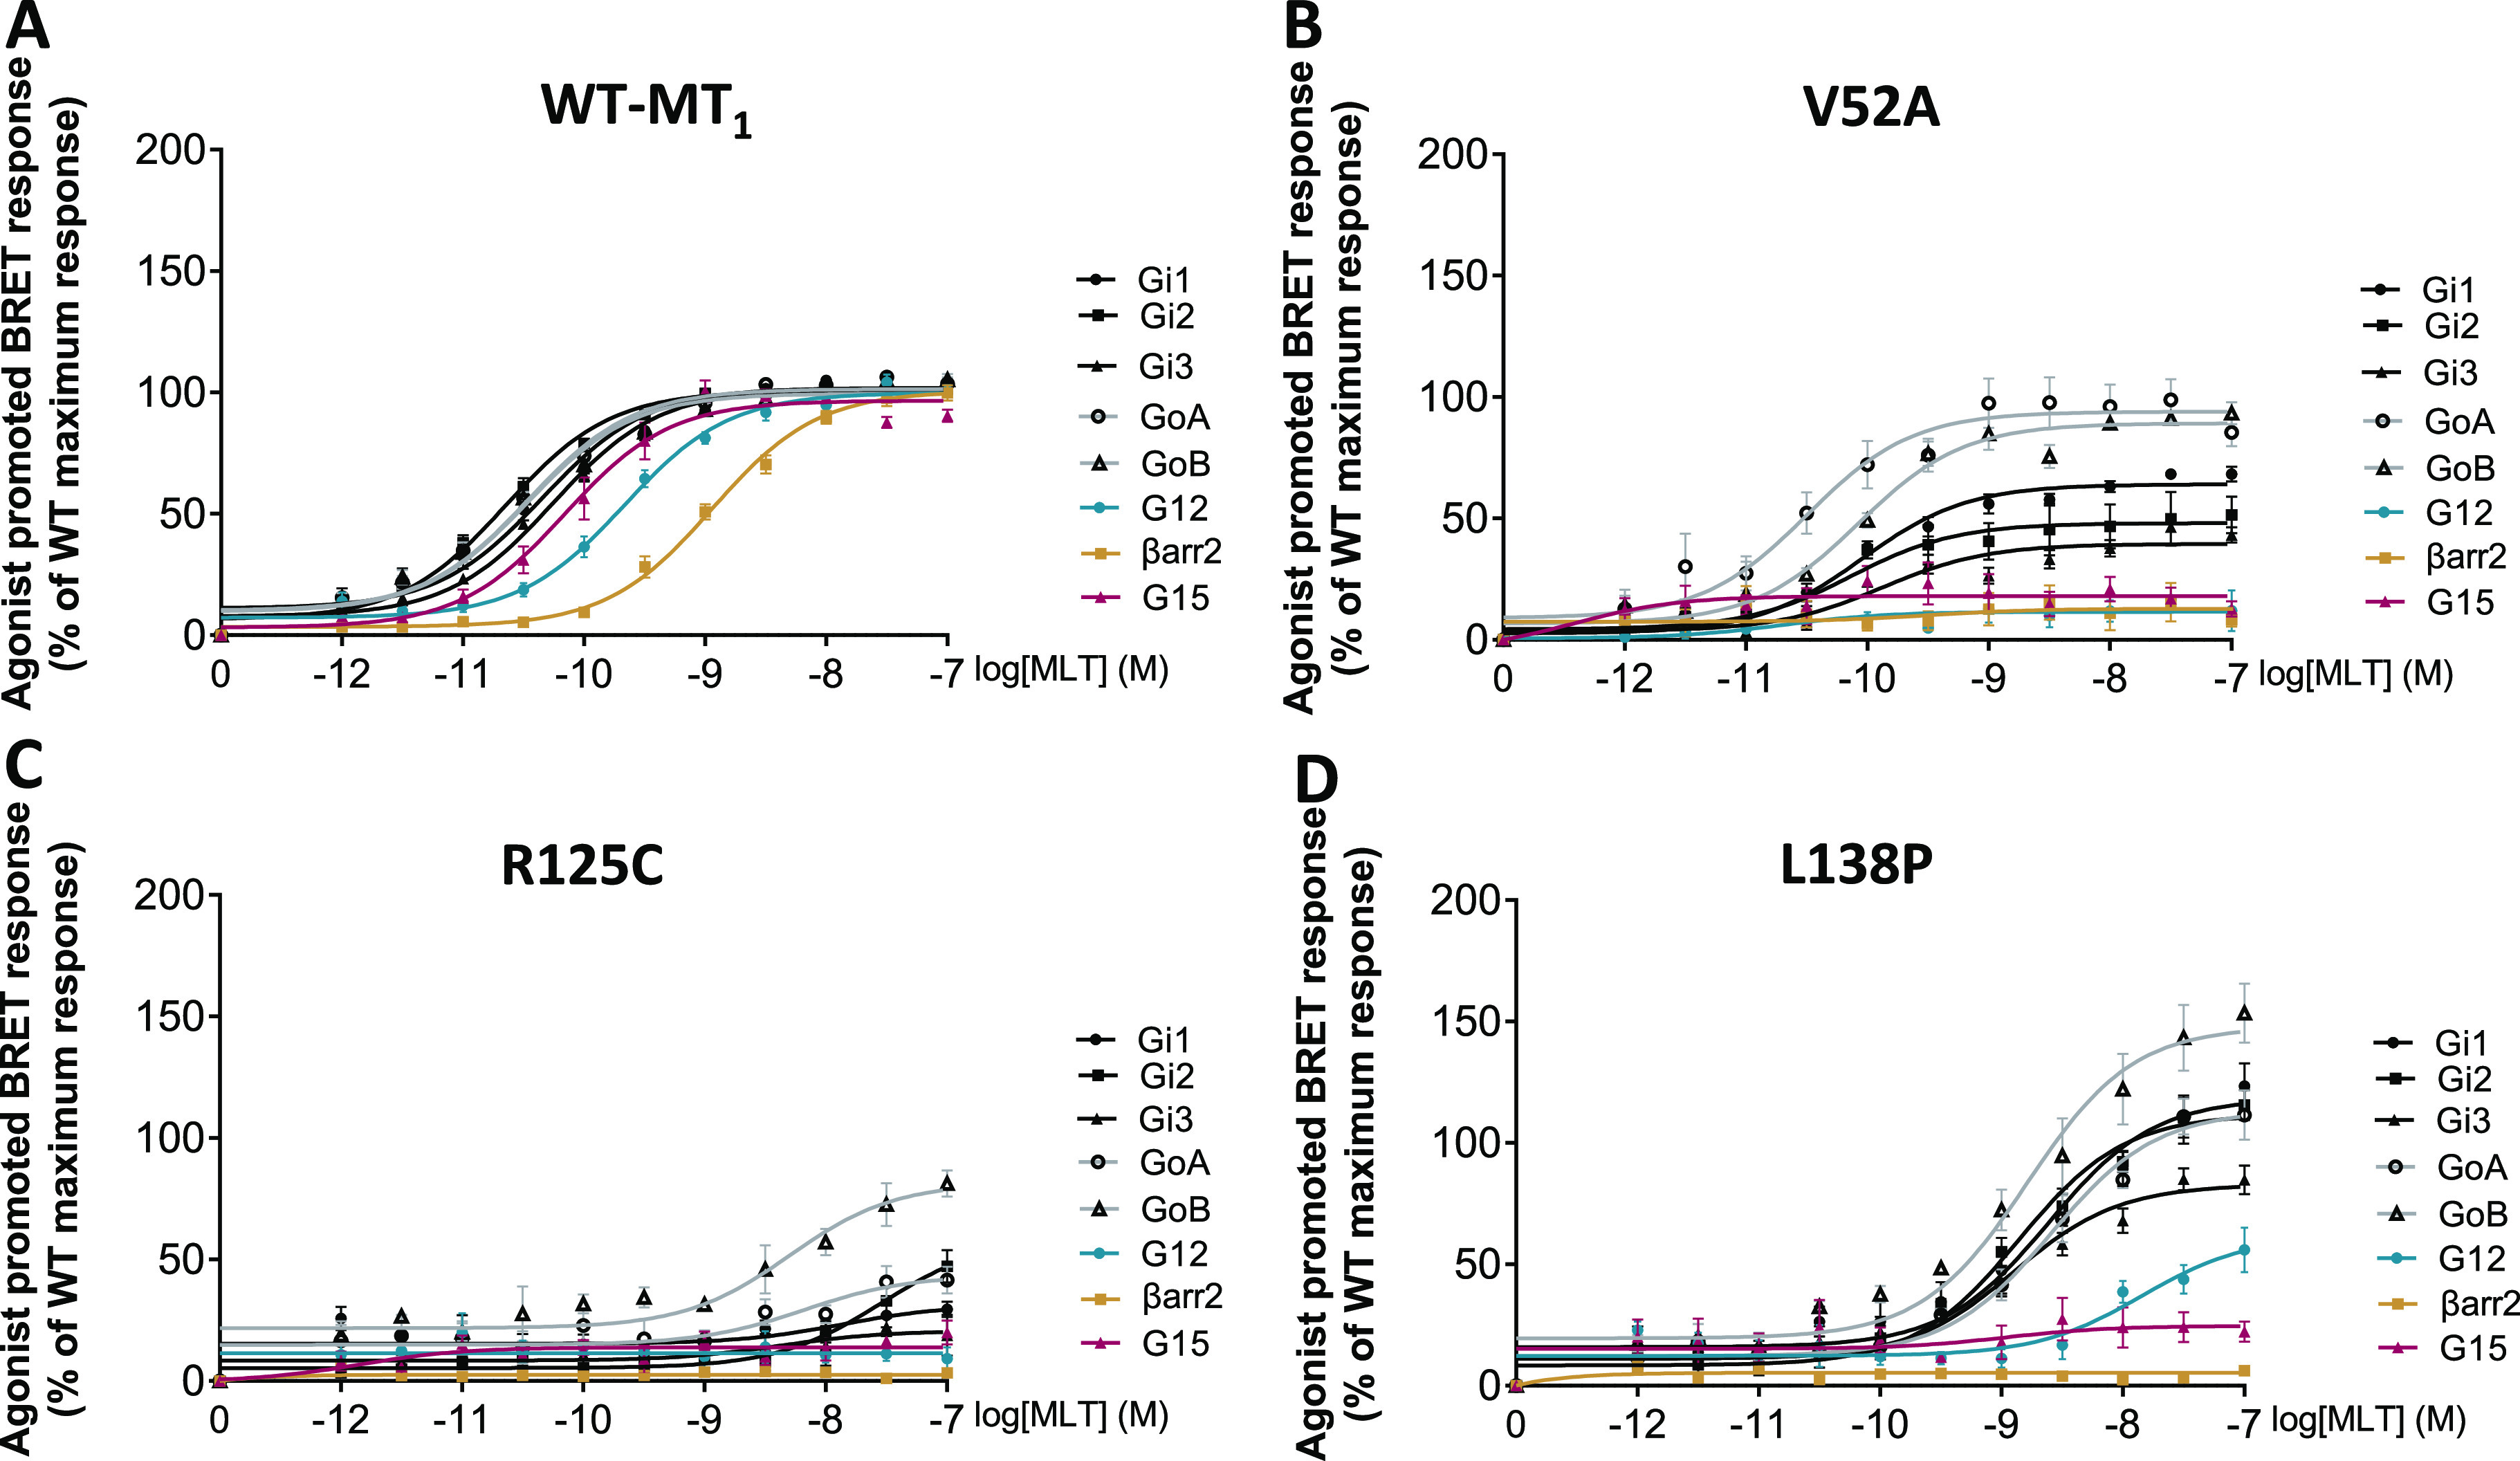
Figure 2.

Melatonin concentration–response curves for G protein activations and βarrestin-2 recruitment of the MT1-WT and representative receptor variants with distinct signaling profiles. MLT concentration curves for (A) MT1-WT, (B) V52A, (C) R125C, and (D) L138P receptors. Data were plotted using nonlinear regression curves with a fixed Hill slope equal to 1. Data points represent means ± SEM of 14 to 16 experiments (A) or 3 to 5 experiments (B, C, D). βarr2: βarrestin-2, WT: wild-type. See also Figure S1. Data were fitted in GraphPad Prism 9.
