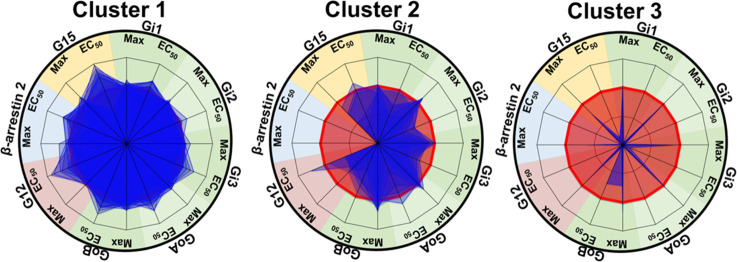
Figure 3.
Radial graph representing the different variant profiles compiled in 3 clusters. Compilation of the different MT1 variant radial graph profiles in three clusters. On each radius, maximal agonist-induced efficacy (Max) and potency (EC50) are indicated. MT1-WT profile is represented in red and mutant profiles are in blue. The values were normalized to fit a −1 to +1 scale using the following formula: (variant – WT)/(variant + WT) as indicated in the methods. A loss of potency or efficacy for a specific protein results in the decrease of the blue area. Data were fitted in Microsoft Excel 2016.

