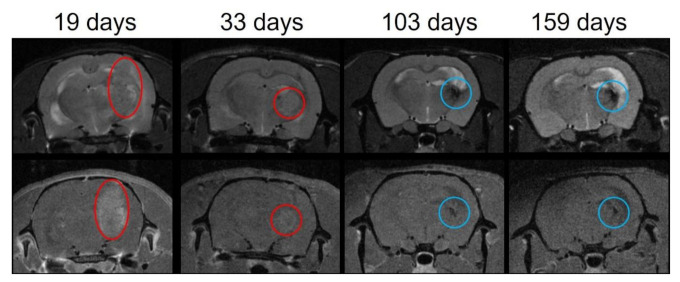
Figure 4.
Example of the longitudinal MRI follow-up of one of the long-term survivors of group 4. Upper row: T2 images. Lower row: T1 RARE images after Gadolinium (Gd) injection. The tumor is identified by the red circle. A large tumor is observed at day 19 after irradiation (V = 104.82 mm3 on the T1 after Gd injection). The tumor size has diminished at day 33 after irradiation (V = 21.55 mm3 on the T1 after Gd injection). No tumor was observed at 103 nor 159 days after irradiation. The blue circle identified the lesion at the tumor bed area.

