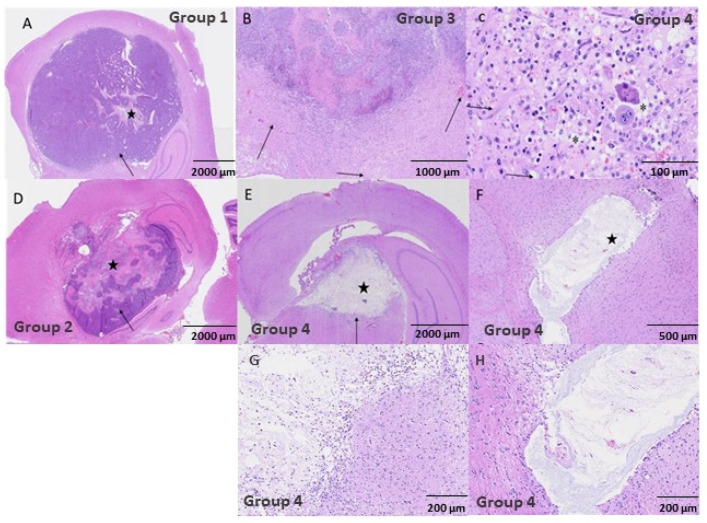
Figure 5.
HE stained histopathology images. (A) corresponds to the non-irradiated control group with a scale bar of 2000 µm. There is a large glioma tumor (arrow) with a small necrotic area of necrosis and inflammation in the center (star). (B–D) depict the group 3 animals with scale bars of 1000 µm and 100 µm, respectively. In (B) there is marked inflammation around the tumor, with mild edema and hemorrhage indicated by the arrows. In (C) we observe peritumoral mixed inflammation with macrophages, lymphocytes, plasma cells, and neutrophils. The neuroparenchyma was expanded by edema and sites of spongiosis are depicted by the asterisks. Glial cells were reactive (arrows). The group 2 animals are shown in (D) with a scale bar of 2000 µm. There are glioma tumoral cells (arrow) with a large central area of necrosis (star). (E,F) are for group 4 animals with scales of 2000 µm and 5000 µm, respectively. In (E) we observe a central pseudo-cystic area of old necrosis (star) surrounded by inflammation (arrow). Panel F depicts a center of necrosis with only pale eosinophilic substance and necrotic cell debris (star), with minimal inflammatory peripheral infiltrate. (G,H) correspond to amplified images of the areas of interest in images (E,F), respectively.

