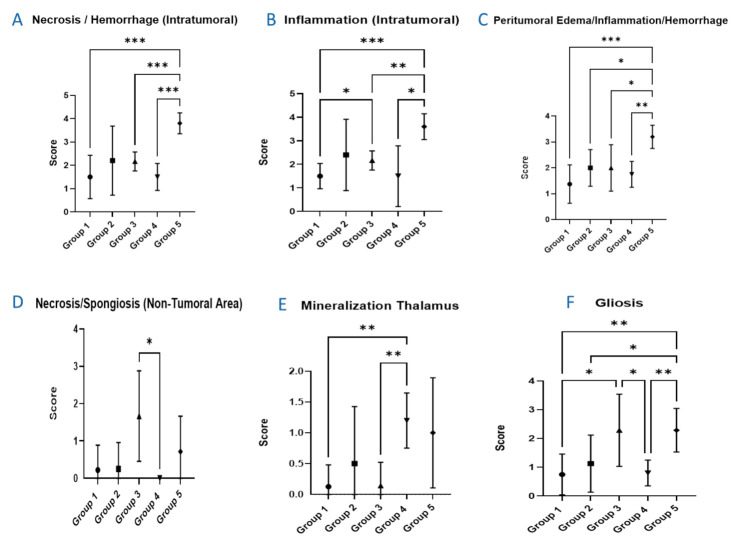
Figure 6.
Presentation of the summary results from the histopathology evaluation. (A) intratumoral necrosis and hemorrhage. (B) intratumoral inflammation. (C) peritumoral edema, hemorrhage, and inflammation. (D) non-tumoral area of necrosis and spongiosis. (E) mineralization of the thalamus. (F) gliosis. Statistically significant differences (p < 0.05) between different groups are represented in the figure by asterisks. Group 1 represents the non-irradiated controls; Group 2 integrates the animals that received pMBRT in one fraction of 15 Gy/array; Group 3 includes the animals that received pMBRT in two fractions of 15 Gy/array; Group 4 depicts the animals that received pMBRT in two fractions of 20 Gy/array; and Group 5 includes the animals having received broad beam irradiations. Statistically significant differences are indicated by *, ** and *** for p values less or equal than 0.05, 0.01, and 0.001, respectively.

